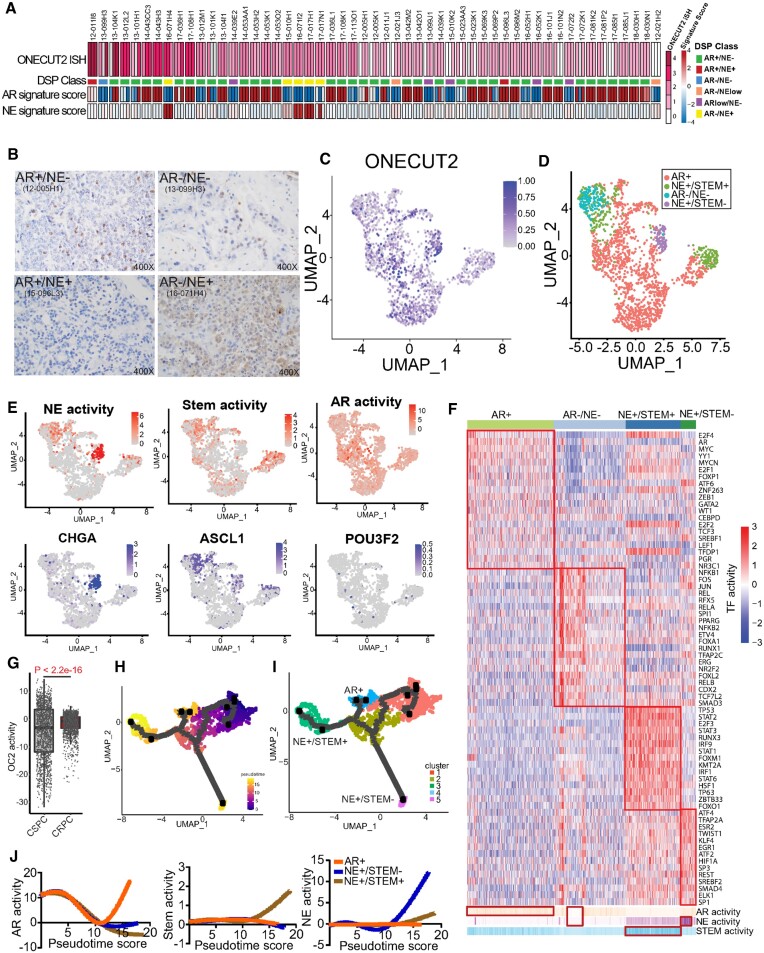
Figure 1.
OC2 is expressed in multiple CRPC lineages. (A) RNA scope in-situ hybridization of OC2 on UW-TMA95 series ((8)). NE and AR signature scores were calculated using RNA-seq data and established digital spatial profiling (DSP) class annotation from the matched samples collected from GSE147250. (Refer to methods).(B) Representative IHC staining of OC2 in CRPC specimens in established phenotypes. (C) UMAP plot illustrating OC2-expressing epithelial cells from 6 CRPC patients scRNA-seq datasets selected for further analysis. (D) UMAP plot illustrating OC2-expressing cells annotated to distinct lineages in CRPC. (E) UMAP plots illustrating OC2-expressing cells colored by three lineage signature activities (AR, NE, Stem) and expression levels of representative markers (CHGA, ASCL1 and POU3F2). (F) Unsupervised clustering of OC2 expressing epithelial cells from 6 CRPC scRNA-seq datasets using transcription factor (TF) activity from the high-confidence DoRothEA database. (Refer to methods). (G) CRPC patient samples show higher OC2 activity compared to CSPC patient samples (Refer to methods). (H) UMAP plot showing the pseudotime trajectory of OC2-expressing cells with progression from CSPC (M0 status) cells to CRPC. (I) UMAP plot showing development of three distinct lineages along the pseudotime trajectory. (J) AR, NE and Stem signatures were computed to track the development of three lineages.

