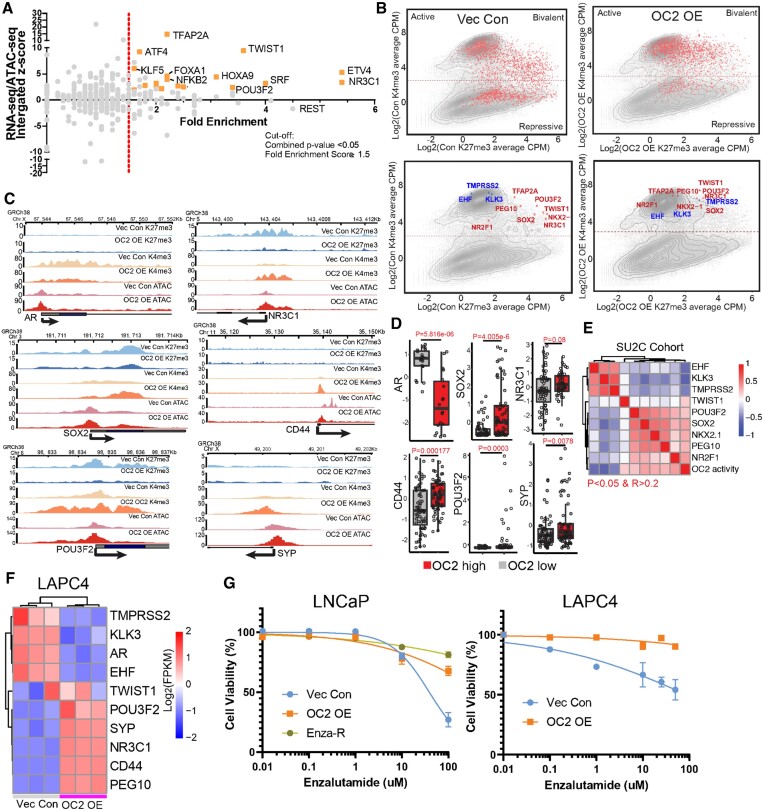
Figure 3.
OC2 activates multiple AR-independent lineage-defining factors. (A) Integrated analysis for identifying OC2-driven candidate TFs based on RNA-seq, ATAC-seq and fold enrichment of downstream targets (refer to methods). Selected candidate genes were labeled in orange. Full candidates list is in Supplementary Table S3 (Cut-off: Fold enrichment score ≥1.5; Combined P < 0.05). (B) Log2 (CPM + 0.1) signal intensity of H3K4me3 and H3K27me3 within ±2 kb of the transcription start site (TSS) where OC2 binds. Each dot represents a unique transcript start site. The cutoff for H3K4me3 separation to indicate active and repression is based on two normal distributions of the signal. Selected genes are highlighted in the bottom row (Red in upregulated genes and Blue in downregulated genes). (C) H3K27me3, H3K4me3 and ATAC-seq signals in LNCaP Vec Con and OC2 OE cells for AR bypass genes AR and GR (NR3C1), NEPC genes (POU3F2 and SYP), Stem genes (SOX2 and CD44). (D) The expression levels of matched selected genes in the SU2C CRPC cohort based on stratification of OC2 activity. (E) Correlation of OC2 activity with candidate TF expression in the SU2C cohort. (F) OC2-driven TFs were also activated in LAPC4 Vec Con and OC2 OE cells (N = 3). (G) OC2 overexpression promotes enzalutamide resistance in LNCaP and LAPC4 cells. LogIC50: LNCaP (1.59 (Vec) versus 2.75 (OC2 OE) versus 4.46 (Enza-R)); LAPC4 (1.95 (Vec) versus 5.49 (OC2 OE))

