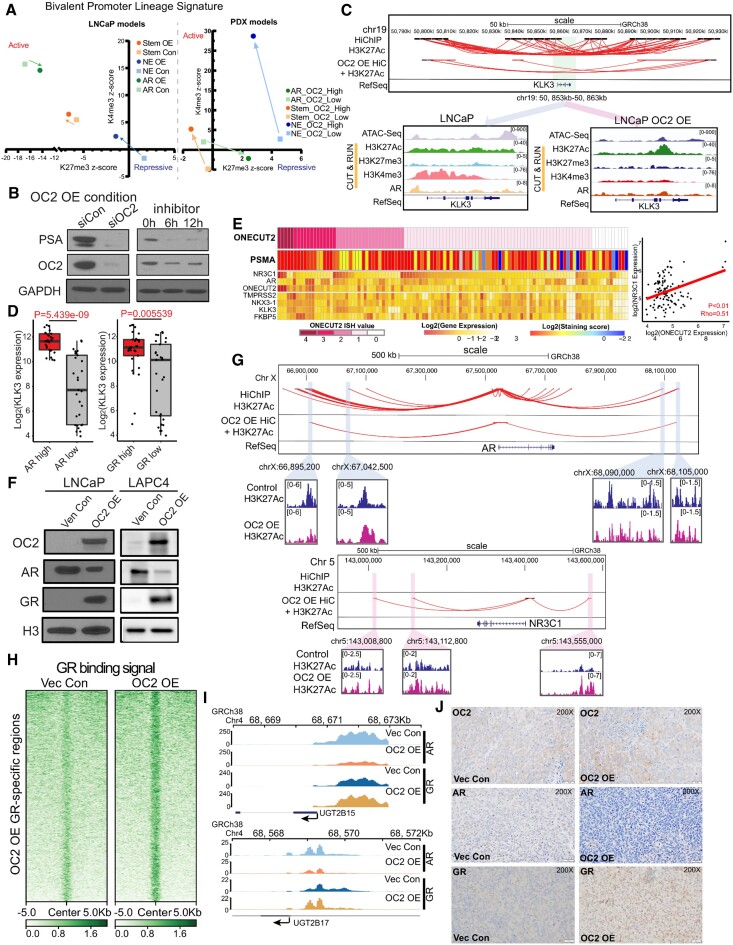
Figure 4.
OC2 activates AR-bypass pathways through GR. (A) Epigenetic status (H3K27me3 and H3K4me3 signal) of the promoters of a panel of lineage signature genes (AR/Stem/NE) represented by average z-score in LNCaP Vec Con and OC2 OE cells (left), and patient derived xenografts (PDX) with OC2 high and OC2 low phenotype (N = 3 for each). (B) OC2 knockdown with siRNA (10 uM) suppressed PSA in the OC2 OE condition, indicating OC2 in controls PSA-expressing lineage in OC2 OE cells. (C) Integrated analysis showed loss of enhancer looping to the KLK3 promoter with OC2 OE (Top). ATAC-seq and CUT&RUN-seq of H3K27Ac, H3K27me3, H3K4me3 and AR binding signals were aligned at KLK3 in LNCaP Vec Con and OC2 OE cells (Bottom). (D) KLK3 expression in AR and GR high versus low groups in SU2C cohorts. (E) mCRPC specimens (8) with evidence of AR activity, based on AR signature and positive PSMA staining, which show high OC2 expression, also exhibited either high AR or high GR expression (left). OC2 mRNA level is positively correlated with GR mRNA with Spearman's correlation coefficient (right). (F) OC2-induced GR upregulation with AR suppression in both LNCaP and LAPC4 cells. (G) Integrated HiC with H3K27Ac loops indicating enhancer regions near AR and NR3C1 (GR) promoter loci. (H) Normalized tag densities of CUT&RUN-seq at specific GR binding regions showed increased GR binding on the chromatin. (I) Loss of AR binding and gain of GR binding at the promoter loci of UGT2B15 and UGT2B17 in LNCaP OC2 OE cells. (J) OC2, AR and GR IHC staining in xenograft models created by subcutaneous injection of LNCaP Vec Con and OC2 OE cells.

