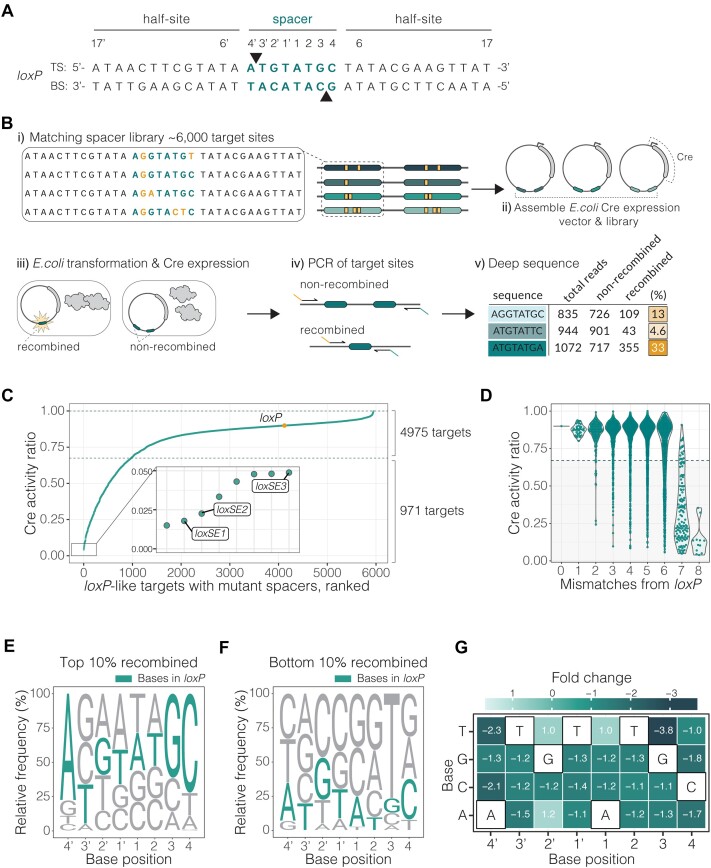
Figure 1.
LoxP spacer library activity screen. (A) LoxP sequence with top (TS) and bottom strand (BS). Bases in the spacer region are labelled and highlighted in teal. The respective attack points of the catalytic tyrosine (Y324) to the DNA strands are indicated by triangles. (B) Schematic of the target site screen. i) Construction of target library around the spacer sequence of the loxP site. Examples of the matching spacers are shown, with alterations to the canonical loxP spacer sequence highlighted in yellow. ii) Library cloning into an E. coli recombinase expression vector. iii) Assembled library vector transformation to E. coli and induced to express Cre. The editing outcomes are indicated by the teal target sites where an active event is recombined and an inactive event is non-recombined. iv) Purification of vectors and subsequent amplification over the target sites with primers containing Illumina indexing sequence. v) Quantification of the recombination rate for each target site calculated from deep sequencing reads (%) displayed in yellow. (C) Target site screen results plotted as activity ratio of Cre recombination (fraction of recombination) for each target site. Activity ratio is calculated for each target site by dividing the activity by the highest activity in the screen. Each dot (teal) represents a unique spacer sequence within the library with wild-type loxP highlighted in yellow. Dotted vertical lines outline the range where the targets are efficiently recombined by Cre, defined by recombination rate ±25% loxP. Plot zoom showing targets with lowest activity. Targets selected for evolution are labeled, loxSE1, loxSE2 and loxSE3. (D) Impact of number of mismatches in the spacer to Cre recombination efficiency. Cre recombination is represented as activity ratio and effects for one (n = 36), two (n = 238), three (n = 831), four (n = 1712), five (n = 1999), six (n = 988), seven (n = 128) and eight (n = 12) mismatches. The wild-type loxP is plotted as a line at 0 mismatches. (E, F) The sequence logos represent spacer preference of Cre. The base height in each logo is calculated by relative frequency in the given subpopulation. The base frequency is normalized to library representation. The logo in E is calculated from a subpopulation of spacer sequences with the highest recombination efficiency or top 10% recombined spacers (n = 595 targets). The logo in F is calculated from a subpopulation of spacer sequences with the lowest recombination efficiency or bottom 10% recombined spacers (n = 595 targets). The loxP bases are colored in teal. (G) Spacer specificity profile of Cre generated from the recombination rates of all target library variants. The heatmap color, and corresponding fold change in each tile, represent the effect of the base change at each position on Cre recombination relative to Cre/loxP recombination. The fold change is calculated from the binomial GLM coefficients. The canonical loxP bases are outlined in black for each base position in the spacer.

