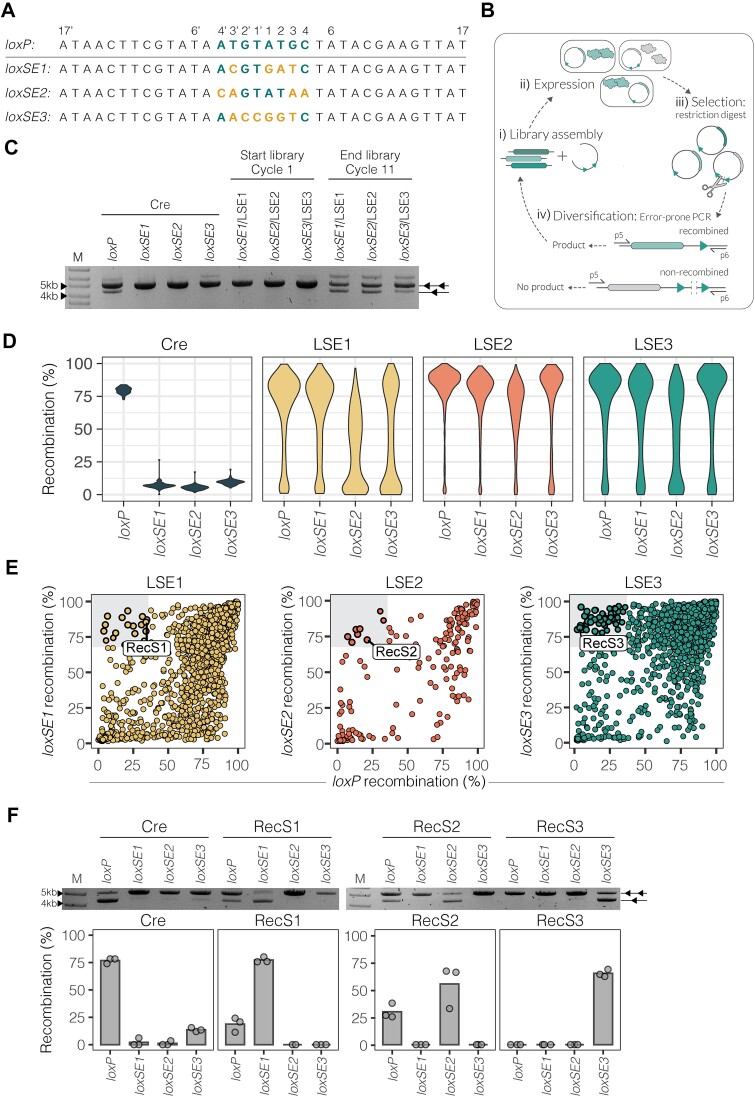
Figure 2.
Evolution of Cre for improved activity on unfavorable spacer sequences. (A) Target site sequences used for evolution aligned to loxP. The spacer base sequence of loxP is colored in teal. Base mismatches from loxP are colored in yellow for the loxSE1, loxSE2 and loxSE3 spacer sequences (written in 5′ → 3′ direction). (B) Evolution schematic. i) Recombinase library assembly to evolution vector. ii) Transformation of assembled vectors to E. coli for induction of recombinase expression. iii) Vector purification and selection for active recombinase variants by linearization of non-recombined vectors carrying the inactive recombinase variant. iv) Error-prone amplification with primers p5 and p6 to insert new mutations to the active recombinase library. Only the non-linearized recombined vectors result in an amplification product and are carried on to the next cycle of evolution. (C) The plasmid-based restriction assays show the activities of Cre, LSE1, LSE2 and LSE3 starting libraries (cycle 1) and ending libraries (cycle 11) on target sites loxP, loxSE1, loxSE2 and loxSE3. Two triangles indicate the non-recombined substrate (5kb) and one triangle indicates the recombined substrate (4.2 kb). (D) Violin plots showing the distribution of recombination (%) (y-axis) for each recombinase variant in the final evolved libraries (after 11 rounds of evolution) and Cre activity on target sites loxP, loxSE1, loxSE2 and loxSE3 (x-axis). The width of each curve in the violin plot corresponds to the approximate frequency of recombinase variants with the equivalent recombination (%). Cre replicates are shown in dark blue (n = 25), the library evolved for loxSE1 (LSE1, n = 1782) is shown in yellow, the library evolved for loxSE2 (LSE2, n = 202) is shown in red and the library evolved for loxSE3 (LSE3, n = 2303) is shown in teal. (E) Scatterplots showing the recombination (%) of each library of their evolved target site along the y-axis compared to recombination (%) of loxP along the x-axis. Each dot represents a unique recombinase and the color indicates the library of the recombinase. The upper left gray square in each plot highlights recombinases specific for the evolved site. The recombinases that were further analyzed are labeled: RecS1, RecS2 and RecS3. (F) Plasmid-based restriction assays showing Cre, RecS1, RecS2 and RecS3 activity for loxP and the evolved target sites loxSE1, loxSE2 and loxSE3. M = GeneRuler DNA Ladder Mix 10kb. The bar plots show the mean recombination (%) of the activities quantified from the band intensities of the plasmid-based restriction assay. The restriction assays were done in triplicates (n = 3). The points represent each individual replicate recombination (%).

