Figure 4.
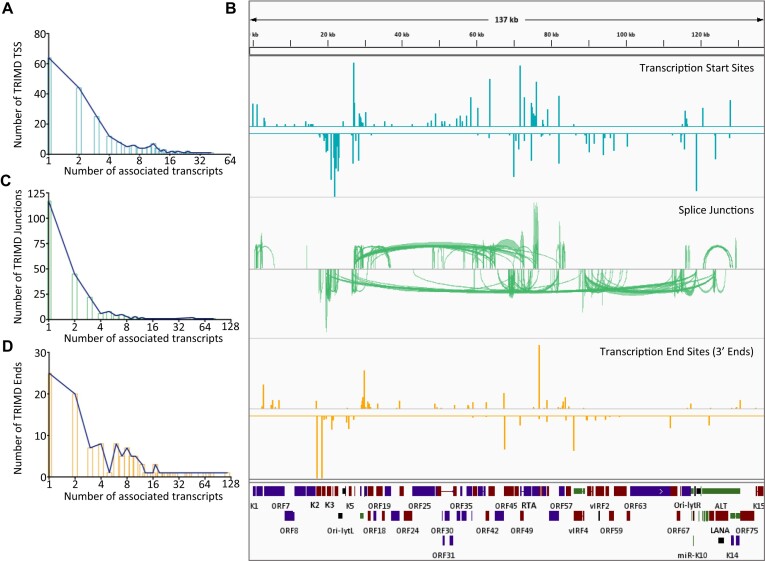
Transcript feature distribution. (A) Distribution of TSSs across TRIMD-identified KSHV transcripts with x-axis representing the number of validated TSSs and y-axis representing the number of transcripts arising from corresponding number of TSS. (B) (from top to bottom) Distribution of TSSs (blue), splice junctions (green) and 3′ends (yellow) over KSHV reference genome with all the top panels displaying the forward transcript features and bottom panels displaying the reverse transcript features. Height of bars for 5′ and 3′ ends and the density of junctions in splice-junctions track represent the relative occurrence of transcripts feature. (C, D) Distribution of splice junctions (C) and 3′ends (D) across TRIMD-identified KSHV transcripts with x-axis representing the number of validated features and y-axis representing the number of transcripts exhibiting the corresponding numbers of features.

