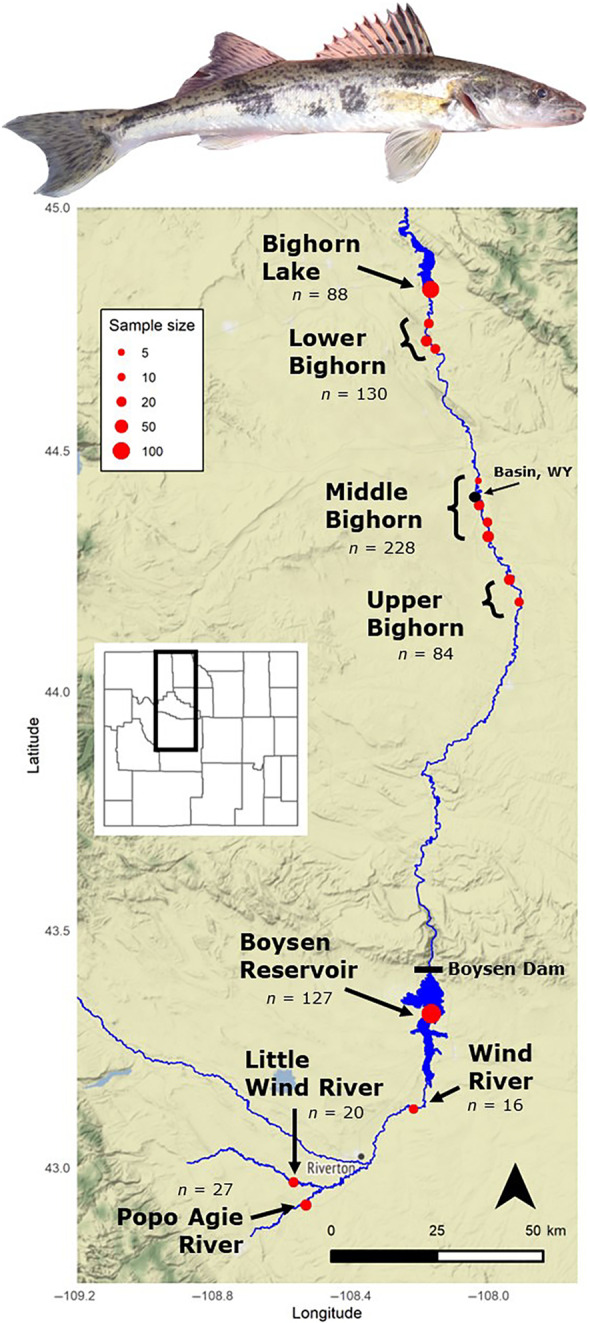
FIGURE 1.

A photograph of a juvenile sauger above a map of the locations at which sauger and walleye were sampled. Red points indicate sampling locations, and the size of each point is relative to the number of samples collected at that location that were retained after sample processing, DNA sequencing, and subsequent filtering.
