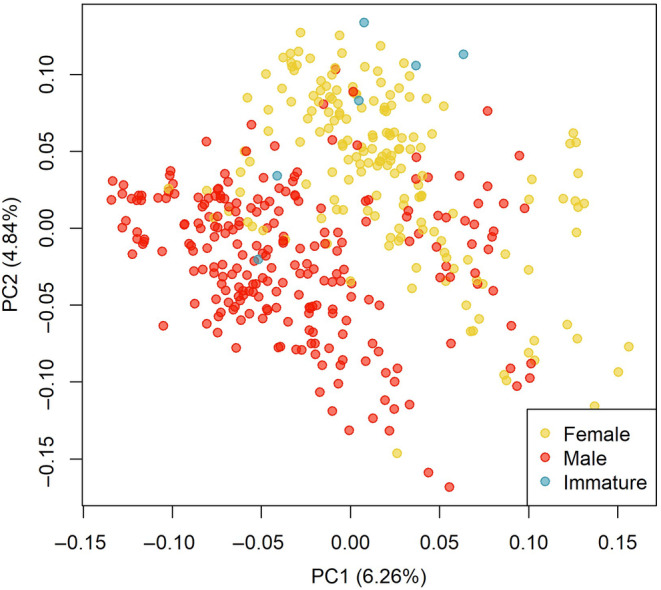
FIGURE 2.

Principal components analysis (PCA) of 6627 genomic loci for the full sauger dataset revealed differentiation associated with sex of the sauger individuals. Each point represents one individual with recorded sex indicated by color. The percent of total variance explained by each principal component is indicated on the x and y‐axis labels. The loci contributing to the divergence between sexes were removed for further analyses of sauger population structure.
