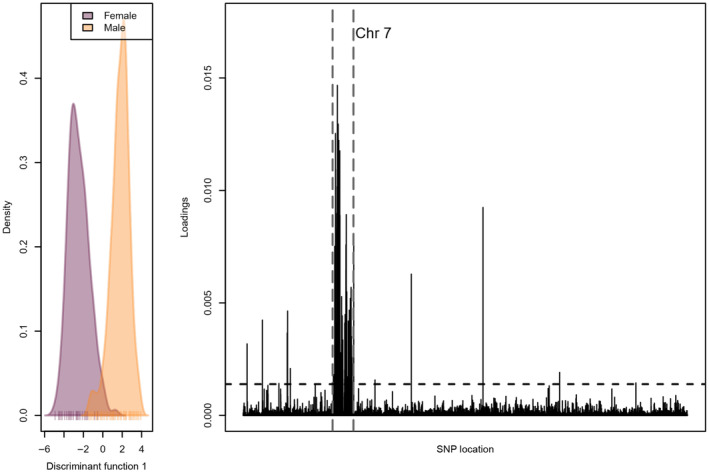
FIGURE 3.

Discriminant analysis of principal components results for all sauger either identified as male or female. The left window shows the distribution of individuals along the first discriminant function (colored by sex), and the right window shows the discriminant function loading for each SNP across the genome. The yellow perch chromosome 7 is highlighted between vertical dashed gray lines, and the horizontal dashed black line shows the significance threshold obtained from a DAPC randomization procedure.
