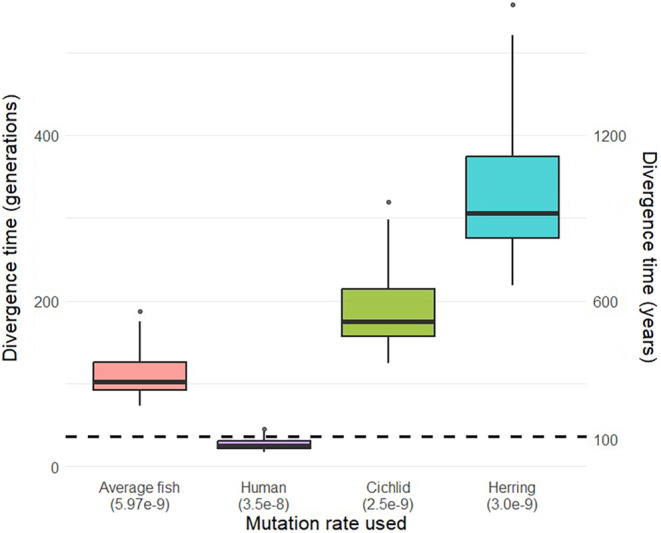
FIGURE 8.

Divergence time estimates from 20 demographic models of sauger populations upstream and downstream of Boysen Dam. Each box in the plot shows the results for all 20 models, but with a different mutation rate used to scale parameter estimates to sauger generations. The second y‐axis shows those same estimates scaled to years using a generation time of 3 years, and the dashed horizontal line shows the time of Boysen Dam's original installation.
