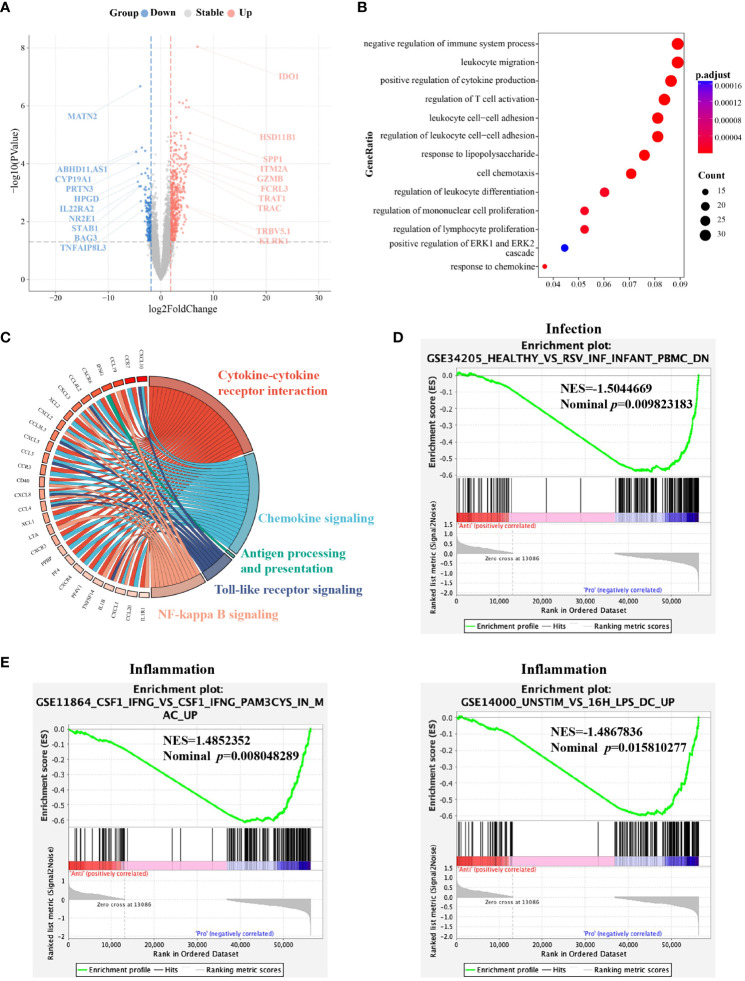
Figure 6.
Molecular characterization of G-MDSCs differentiation as immune reconstitution progresses. (A) Volcano plot shows the differently expressed genes between the granulocytic myeloid-derived suppressor cells (G-MDSCs) in patients (n=7 each) at day 28 and day 90, respectively (|log2FC| >1, adjusted p<0.05). Red dots reveal genes expressed at a higher level at day 90. Blue dots represent the genes downregulated at day 90 compared to day 28. (B) Enriched GO terms were identified for elevated genes in G-MDSCs from patients at day 90 (adjusted p<0.05). (C) The GESA KEGG chord plot illustrates the connections among highly expressed genes in G-MDSCs at day 90 and their associated pathways, visually represented through connecting ribbons (NES>1, adjusted p<0.05). (D, E) GESA of genes expressed in G-MDSCs has been performed. Infection and inflammatory-associated pathways were enriched in G-MDSCs from patients at day 28.

