
Figure 9.
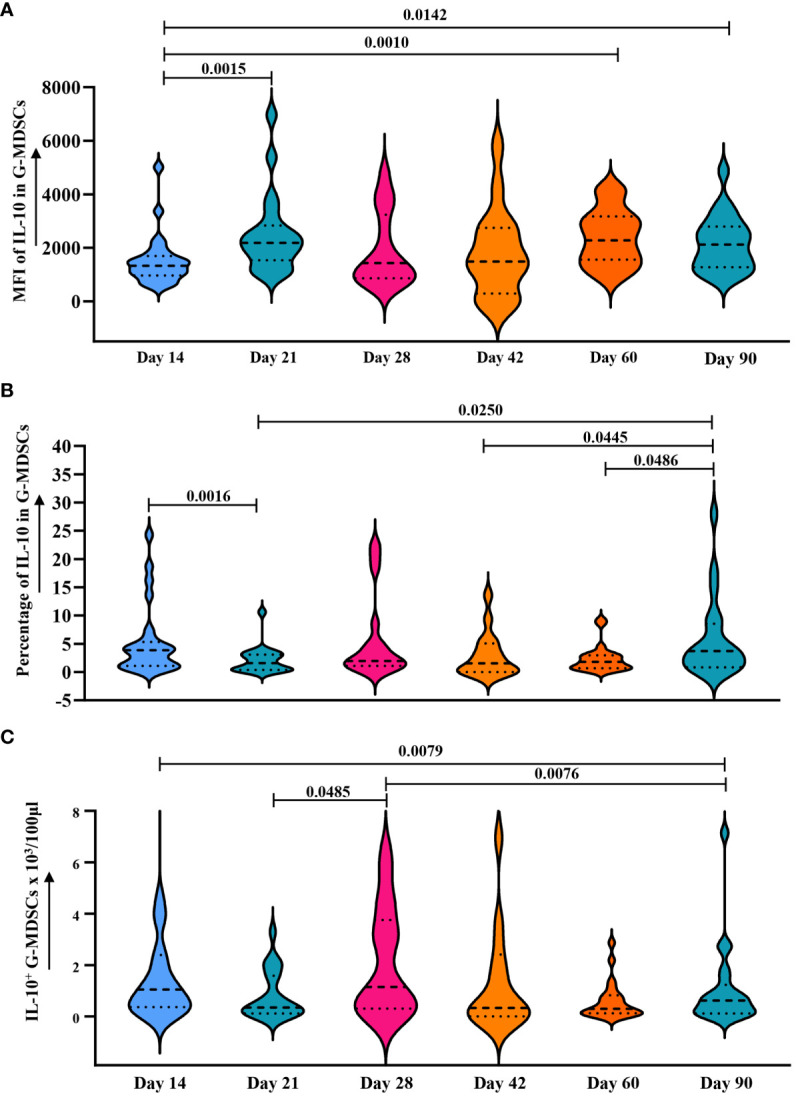
Dynamic analysis of IL-10 expression in G-MDSCs within 90 days. (A–C) Dynamic change of median fluorescence intensity (MFI) of IL-10 in G-MDSCs, as well as percentage of interleukin-10 (IL-10) in G-MDSCs and absolute count of IL-10+ G-MDSCs in patients at day 14 (n=25), day 21 (n=20), day 28 (n=17), day 42 (n=16), day 60 (n=23), and day 90 (n=21) were analyzed using flow cytometry. Dashed lines indicate the mean and quartiles of the data.