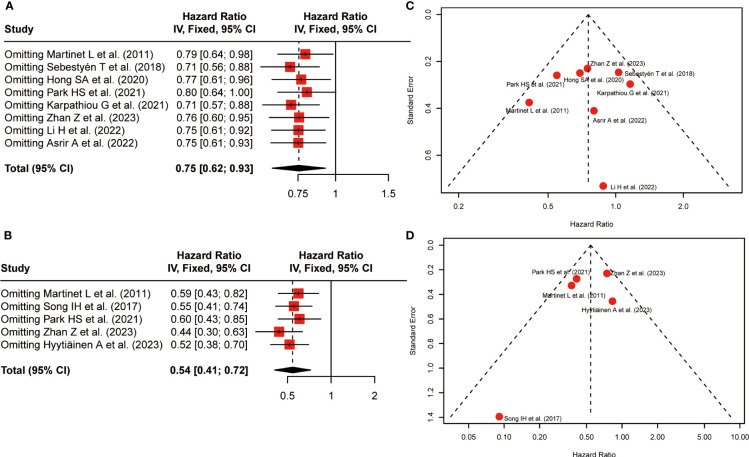
Figure 4.
Sensitivity analysis and funnel plots. (A) Sensitivity analysis for the association between HEV positivity and OS; (B) Sensitivity analysis for the association between HEV positivity and DFS; (C) Funnel Plot to detect publication bias of positive-HEVs on OS; (D) Funnel Plot to detect publication bias of positive-HEVs and DFS.

