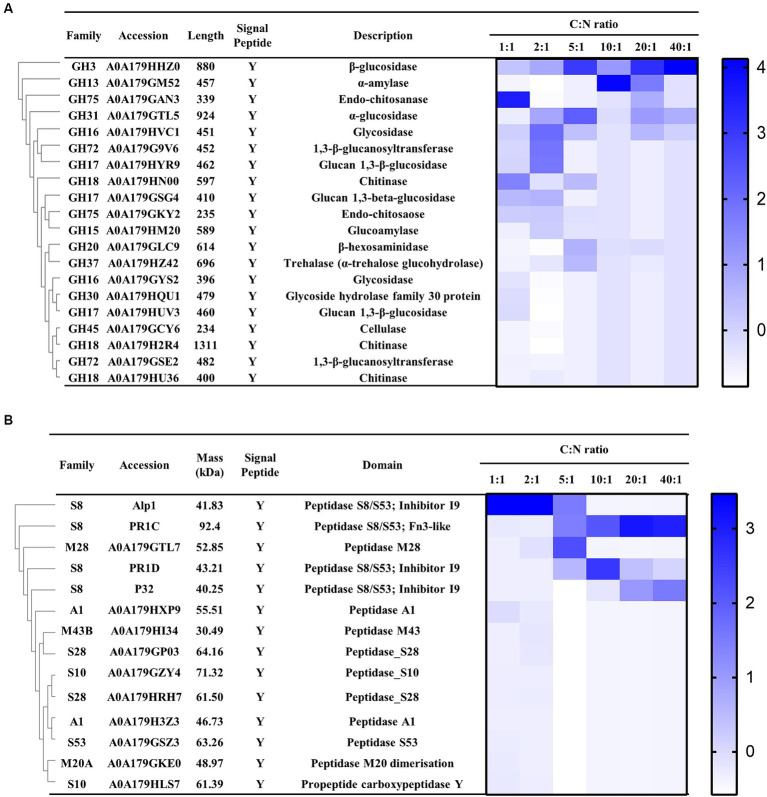
Figure 4.
Expression profile of P. lilacinum grown for 96 h under different C:N ratios (1:1, 2:1, 5:1, 10:1, 20:1, and 40:1), detected by LC–MS/MS. (A) Cluster analysis of extracellular glycoside hydrolases secreted by P. lilacinum. (B) Cluster analysis of extracellular proteases. The color intensity corresponds to the relative content of each enzyme.

