Figure 1.
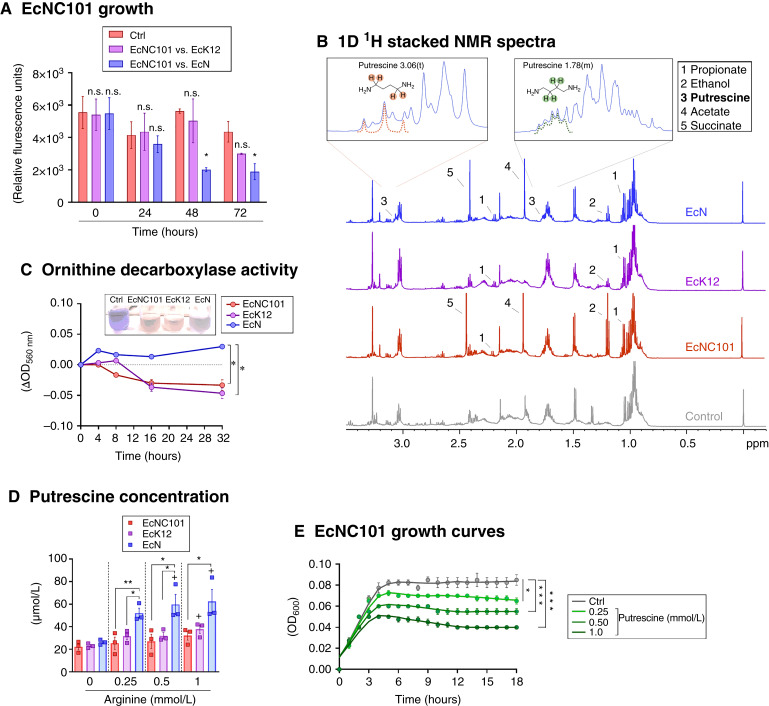
Putrescine inhibits the growth of EcNC101. A, Growth of EcNC101 in liquid competition assays with K12 or EcN strains in comparison with the growth of EcNC101 without competition (Ctrl) at each time point (ANOVA, compared with single strain culture of EcNC101 at each time point; N = 4). B, Representative one-dimensional 1H NMR spectra (−0.2–3.5 ppm) of supernatants from EcN, EcK12, EcNC101, and control (LB); sodium (TSP) at 0.0 ppm was the reference peak. Inset images represent putrescine peaks by 1H NMR. C, ODC activity of EcNC101, EcK12, and EcN in minimal medium (M9) with arginine (repeated-measure ANOVA; N = 4). Representative image of the culture media change of color at 32 hours. D, Putrescine concentration measured in the supernatant of EcNC101, EcK12, and EcN grown in M9 in the absence or presence of an increasing concentration of arginine for 7 hours [ANOVA, compared with control (0 mmol/L arginine) of each strain; N = 3]. E, Growth curves of EcNC101 in M9 in the absence or presence of putrescine supplemented at different concentrations (ANOVA, compared with control; N = 4). n.s., nonsignificant; *, P < 0.05; **, P < 0.01; ***, P < 0.001.

