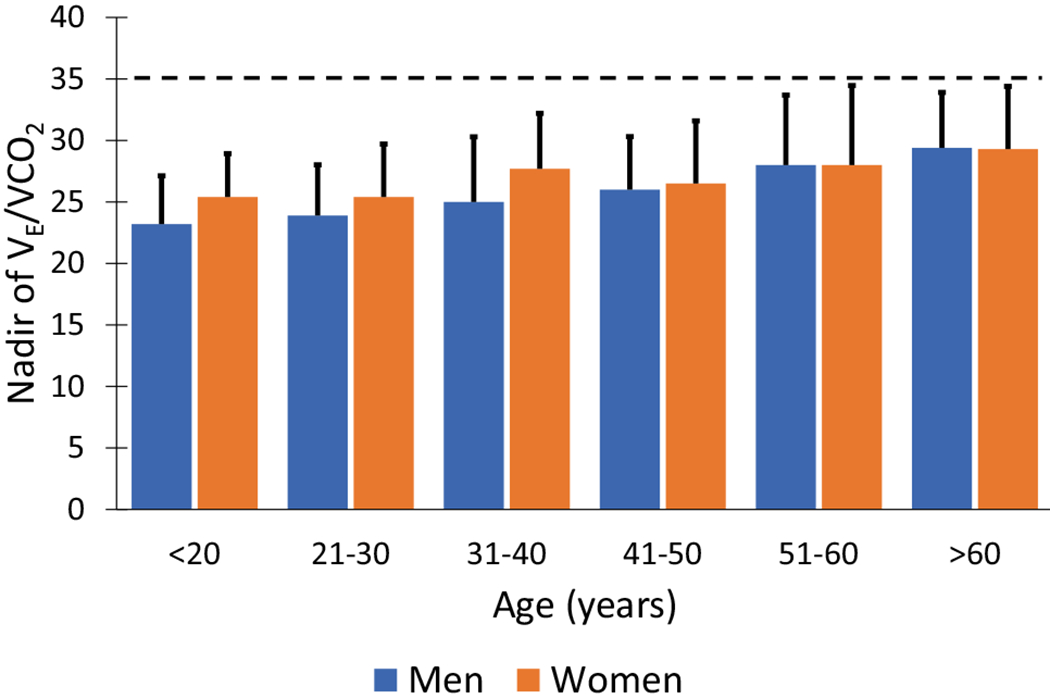
Fig. 5.

Nadir of VE/VCO2 in men and women. Bars represent the mean, and the error bars are the upper limit of normal (i.e., 1.96 × standard deviation). Horizontal dashed line represents “rule of thumb” upper limit of normal for men and women. Data adapted from Sun et al. [32]
