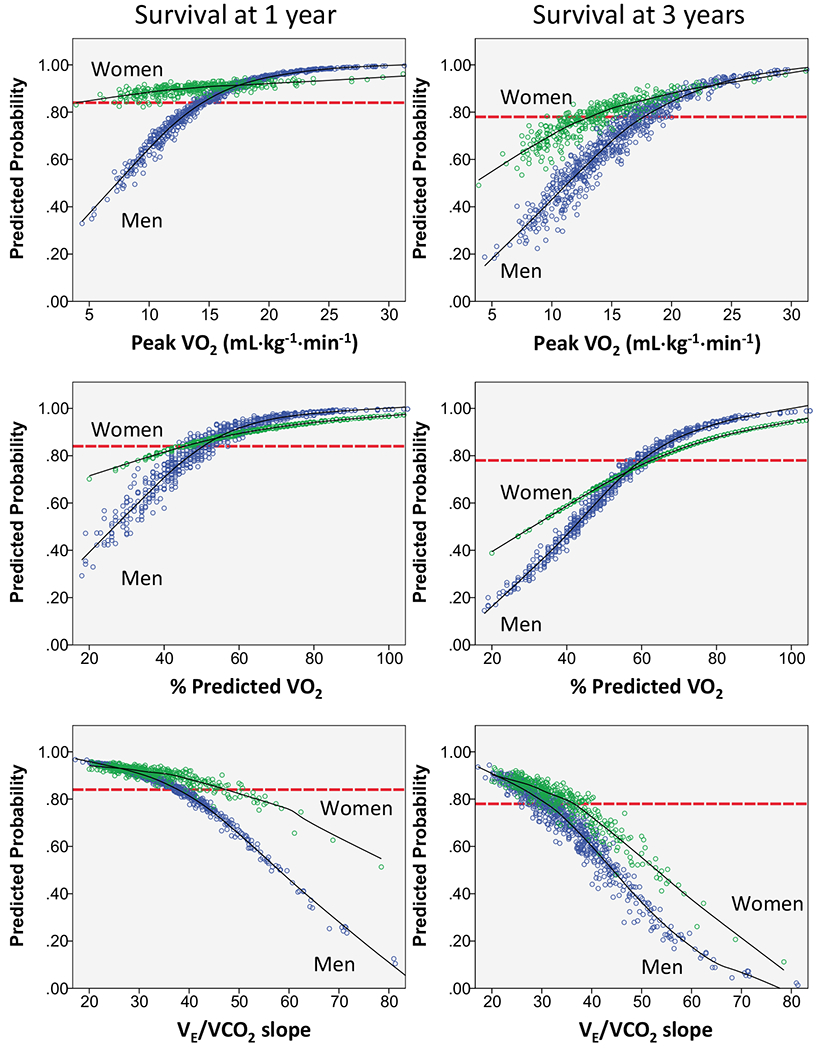
Fig. 6.

Logistic regression scatterplots for a 1- and 3-year composite outcome for each cardiopulmonary exercise test variable. The probability of survival free from death, left ventricular assist device implant, or cardiac transplant is depicted using logistic regression for the composite outcome at 1 and 3 years for peak VO2, percent-predicted peak VO2, and VE/VCO2 slope. Each individual’s predicted survival probability is plotted, and a line of best fit is drawn for both men (blue dots) and women (green dots). Perspective horizontal dashed lines are placed on the graphs to depict the 1- (84%) and 3-year (78%) North American cardiac transplant survival rate. VE/VCO2 slope, slope of minute ventilation relative to carbon dioxide exhaled; VO2, peak oxygen uptake. Figure from Ehrman et al. [37]. Reprinted with permission from Elsevier
