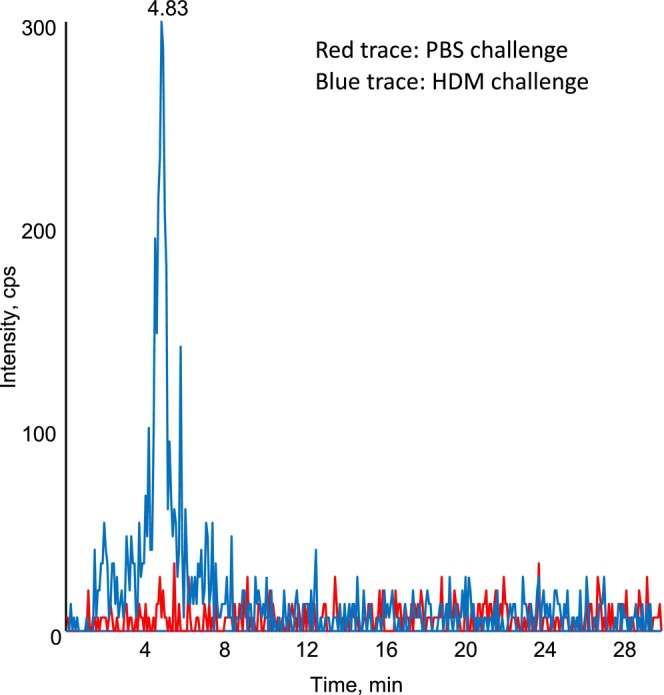
FIGURE 1.

Chromatogram of m/z 351–115 showing the presence of a detectable peak in mouse lung homogenate following HDM challenge. Lipid extracts from mouse lung homogenate from mice challenged with HDM (blue) or PBS control (red) were analysed using LC/MS/MS as outlined in the methods.
