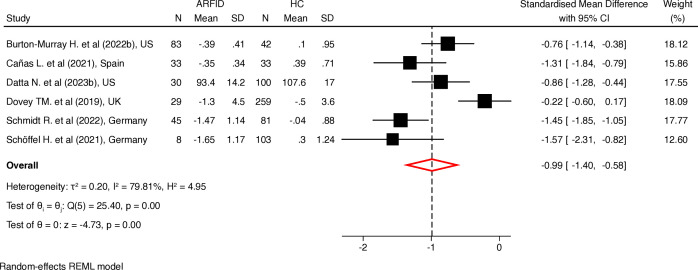
Figure 2.
Forest plot showing standardised mean difference in BMI z-scores and %Median BMI between ARFID (n=228) and HC (n=618). 95% CIs and study weights and indicated. The overall effect size was calculated using a random effects model. ARFID, avoidant restrictive food intake disorder; BMI, body mass index; HC, healthy control.

