
FIGURE 3.
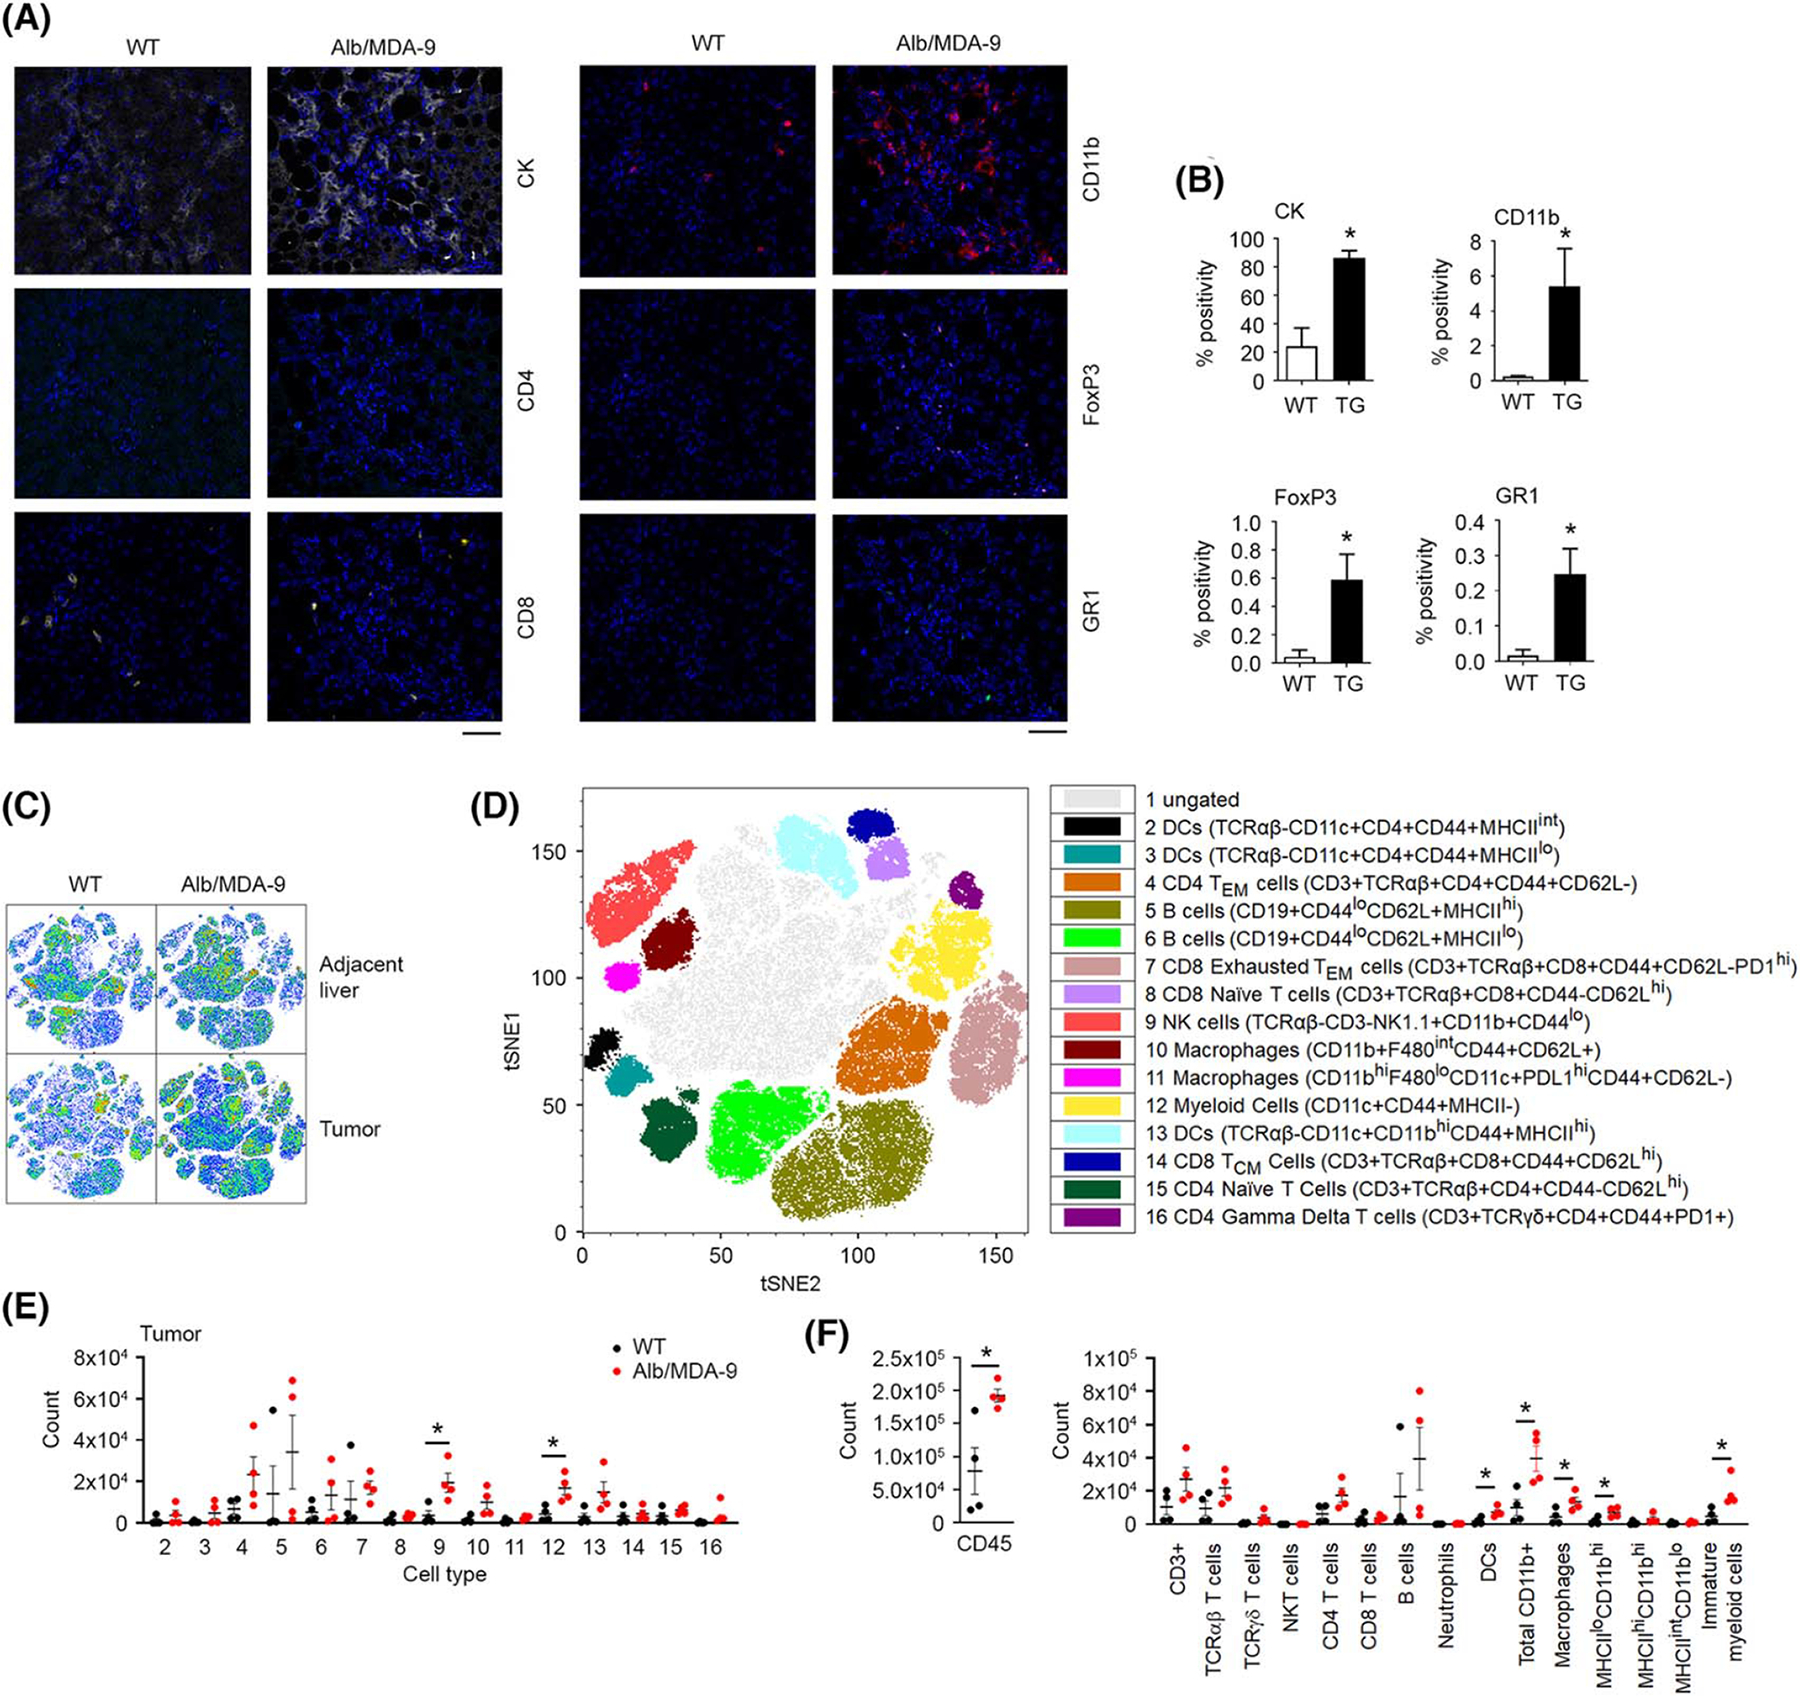
Myeloid cell infiltration is augmented in Alb/MDA-9 liver tumors. (A) Representative photomicrograph of multiplex immunofluoroscent staining of the indicated cell markers in DEN/PB-induced WT and Alb/MDA-9 liver tumors. Magnification: 200×. Scale bar: 10 μm. (B) Quantification of (A). Data represent mean ± SEM. *p < 0.01. (C) High-dimensional flow cytometry was performed on liver tumors and adjacent normal liver. Shown are t-distributed stochastic neighbor embedding (tSNE) plots of cell populations from tumor and adjacent liver concatenated by groups. (D) Concatenated tSNE plot with 16 identified cell populations. (E) Cell count from WT and Alb/MDA-9 tumors identified in (D). (F) Cell count from tumors for cell populations gated in Figure S5. Black dots: WT mice, red dots: Alb/MDA-9 mice. For (E) and (F), data represent mean ± SEM. *p < 0.05 versus WT. N = 4 mice/group. Alb, albumin; CK, cytokeratin; DC, dendritic cells; DEN, N-nitrosodiethylamine; FoxP3, forhead box P3; GR1, lymphocyte antigen 6 complex, locus G (Ly6g/Gr-1); MDA-9, Melanoma differentiation associated gene-9; NK, natural killer; PB, phenobarbital; TG, transgenic; WT, wild-type.