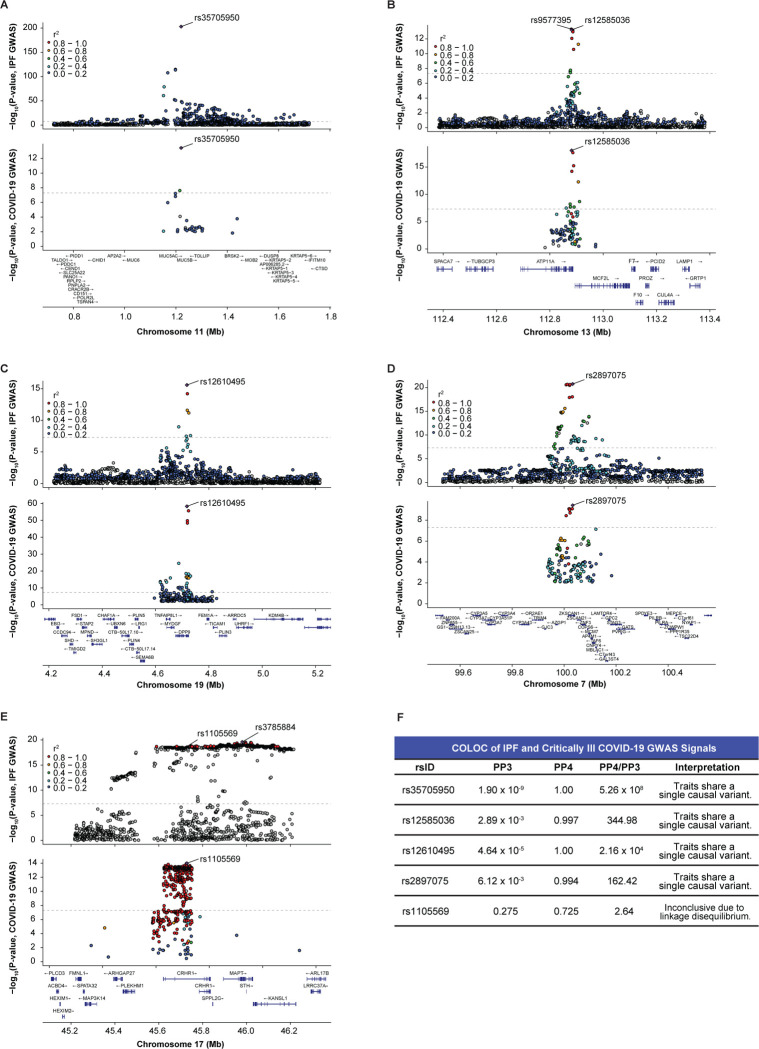
Figure 2: IPF and critically ill COVID-19 GWAS colocalize at shared signals.
(A) LocusZoom plot highlights that rs35705950 is the lead variant (purple diamond) in both disease GWAS and is located upstream of MUC5B on chromosome 11.
(B) rs12585036 is a top variant in the IPF GWAS and is in strong LD with the lead variant (rs9577395). rs12585036 is the lead variant in the COVID-19 GWAS and is located within an intron of ATP11A on chromosome 13.
(C) rs12610495 is the lead variant in both disease GWAS and is located within an intron of DPP9 on chromosome 19.
(D) rs2897075 is the lead variant in both disease GWAS and is located within an intron of ZKSCAN1 on chromosome 7.
(E) rs1105569 is a top variant in the IPF GWAS and is in strong LD with the lead variant (rs3785884). rs1105569 is the lead variant in the COVID-19 GWAS. rs1105569 is located within an intron of CRHR1 and in a supergene with high linkage disequilibrium between SNPs.
(F) COLOC indicates strong colocalization between the disease GWAS signals at four of the five shared SNPs with PP4 > 0.900, and PP4/PP3 > 5.00. COLOC is inconclusive for rs1105569 due to extensive linkage disequilibrium in the region.
P-values are −log10 transformed, and the dotted line indicates the genome-significant threshold at p < 5.0 × 10⁻⁸. Linkage disequilibrium information for European populations was obtained from LDlink and is relative to the lead variant in each plot.

