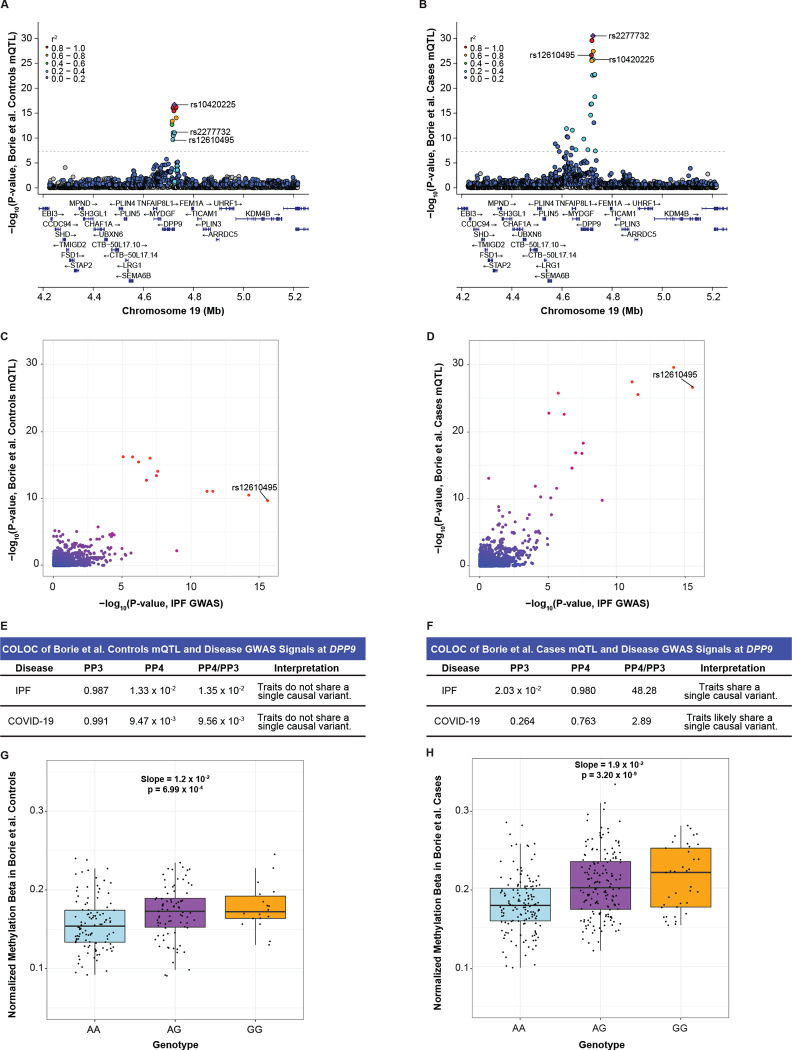
Figure 6: Colocalization at rs12610495 reveals a differentially methylated site (cg07317664) near the DPP9 transcription start site in IPF cases.
(A) LocusZoom plot shows that rs12610495 is not the lead mQTL nor in LD with the lead mQTL (rs10420225; urple diamond) for cg07317664 in controls in the Borie et al. dataset.
(B) rs12610495 is a top mQTL and in LD with the lead mQTL (rs2277732) for cg07317664 in IPF cases.
(C) Comparison of −log10(p-values) from the IPF GWAS and cg07317664-mQTLs in controls shows rs12610495 as a top shared SNP.
(D) Comparison of −log10(p-values) from the IPF GWAS and cg07317664-mQTLs in IPF cases shows rs12610495 as the lead shared SNP.
(E) COLOC does not support colocalization between the disease GWAS and cg07317664-mQTL signals in controls with PP4 < 0.700.
(F) COLOC indicates colocalization between the disease GWAS and cg07317664-mQTL signals in cases with PP4 > 0.700.
(G) Box plot for normalized methylation beta in controls by genotype.
(H) Normalized methylation beta in IPF cases by genotype.
P-values in LocusZoom plots are −log10 transformed. Linkage disequilibrium information for European populations was obtained from LDlink and is relative to the top variant in each plot. Slopes and p-values for genotype methylation beta boxplots were obtained through linear regression modeling.

