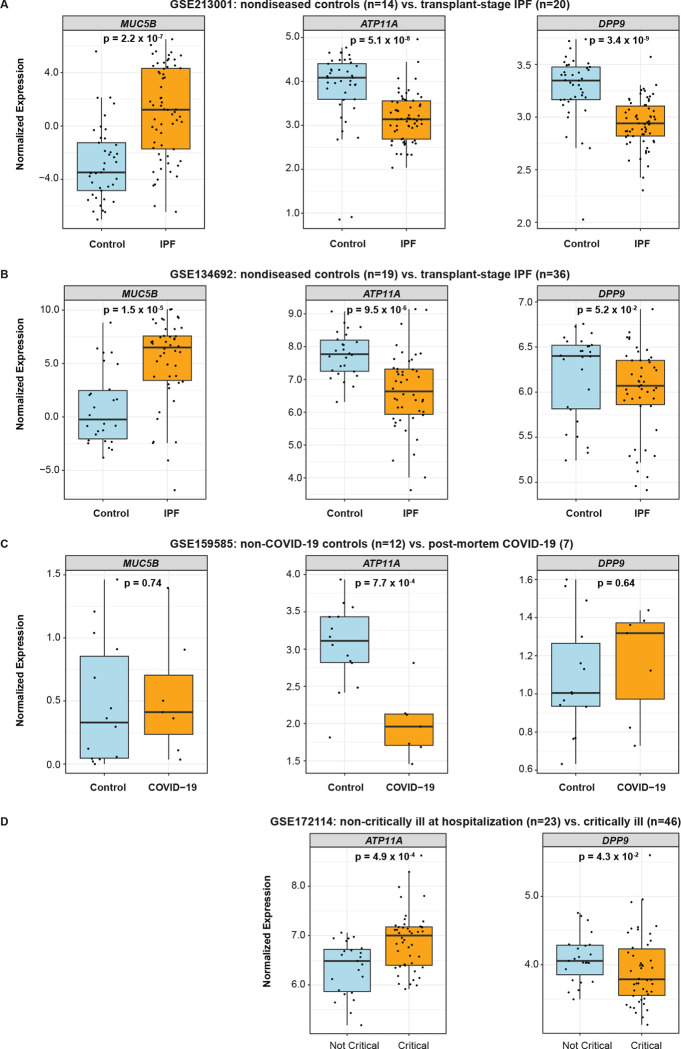
Figure 8: Assessment of causal genes in bulk control and diseased tissue from independent studies.
Box plots depict normalized expression of causal genes by diagnosis from:
(A) GSE213001, which included lung tissue from non-diseased controls (n=14) and IPF patients undergoing lung transplant (n=20).
(B) GSE134692, which included lung tissue from non-diseased controls (n=19) and IPF patients undergoing lung transplant (n=36).
(C) GSE159585, which included lung tissue from non-diseased controls (n=12) and from patients who succumbed to COVID-19 (n=7).
(D) GSE172114, which included whole blood samples from hospitalized patients with non-critically ill COVID-19 (n=23) and patients in the intensive care unit with critically ill COVID-19 (n=46).
P-values were calculated using the Mann-Whitney U test.

