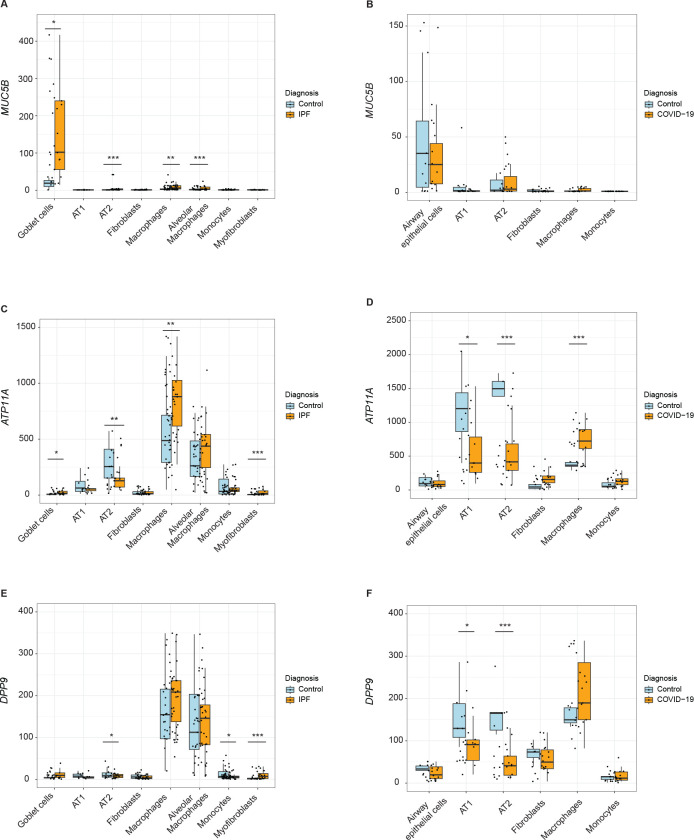
Figure 9: Assessment of causal genes at the single-cell resolution in control and diseased tissue.
Box plots depict normalized expression of (A) MUC5B, (C) ATP11A, and (E) DPP9 in an IPF single-cell RNA sequencing study by Adams et al. which included controls (n=28) and IPF patients (n=32). Box plots depict normalized expression of (B) MUC5B, (D) ATP11A, and (F) DPP9 in a lethal COVID-19 single-nucleus RNA sequencing study by Melms et al. which included controls (n=7) and COVID-19 patients (n=19).
P-values were calculated using Wald test with P values adjusted for multiple comparisons using the Benjamini-Hochberg method (*Padj < .05; **Padj < .001; ***Padj < .0001).

