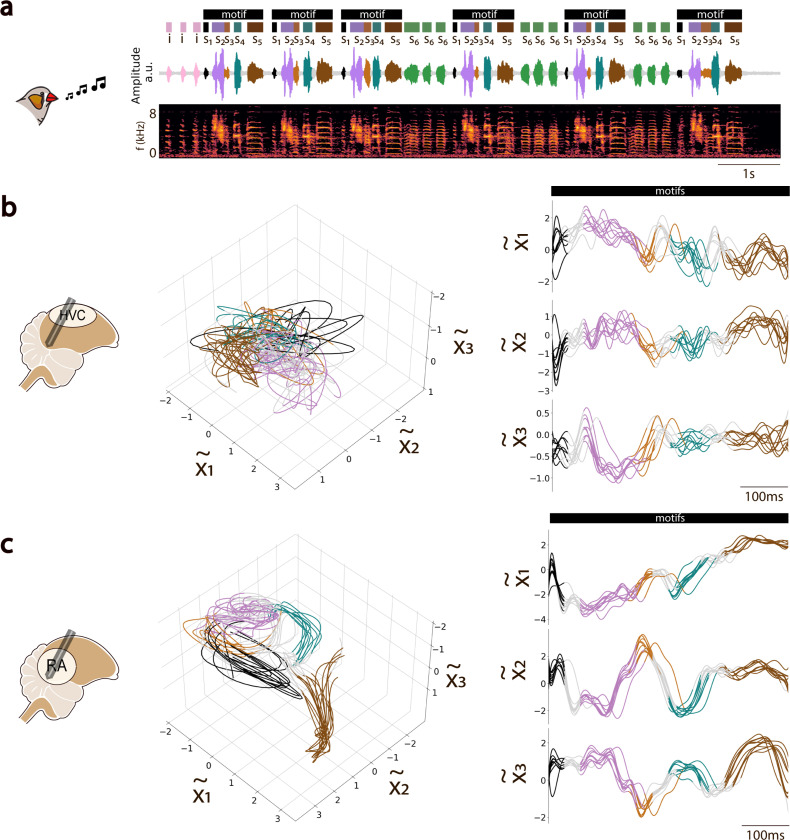
Fig. 3. State-Space Analysis of Motor Nuclei Activity in the Song-Motor Pathway.
a. Amplitude waveform and spectrogram of a recorded song bout from a male zebra finch. The bout features multiple motifs, comprising individual syllables ( to ), color-coded from black to brown, with additional intra-motif notes (, green) and introductory notes (, pink) preceding the first motif. b. HVC neural trajectories during motif repetition, inferred by projecting HVC activity onto a latent manifold defined by the leading three GPFA factors (left). Trajectory subsegments are color-coded to match associated song syllables. The same trajectories are also shown projected onto each of the three-dimensional axes (GPFA factors), arranged in descending order by variance explained (right). c. Same as in (b) but for GPFA-inferred neural trajectories in RA. Comparing b and c highlights the larger degree of smoothness and temporal structure in the activity of RA across vocal repetitions compared to the greater variability observed in HVC during the same song bout.

