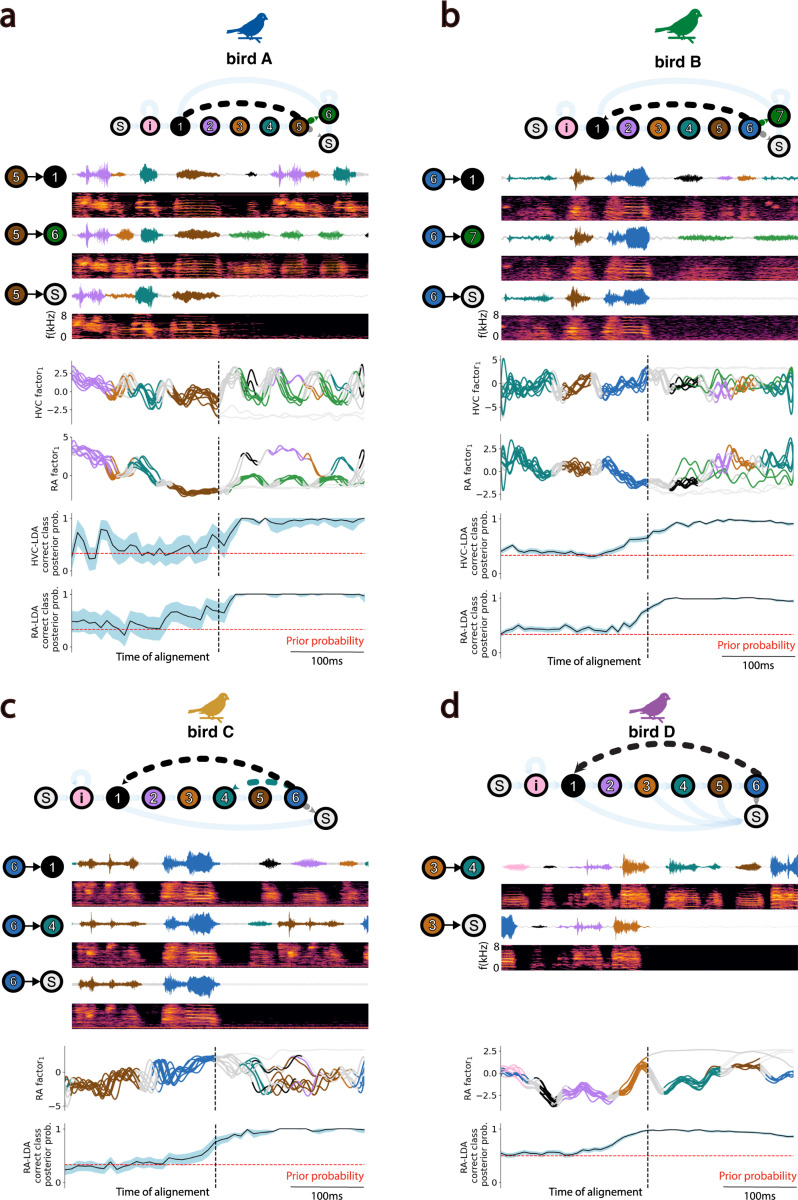
Fig. 6. HVC and RA Latent States predict Vocal Transitions.
Each panel (a-d) features a state diagram at the top illustrating both deterministic and probabilistic vocal transitions between syllables (colored circles) in the song of individual birds. Beneath, amplitude waveforms and corresponding spectrograms display examples of specific probabilistic transitions following a selected branching syllable in each bird’s own song. Below, HVC and/or RA neural trajectories for ten randomly chosen vocal renditions are aligned to the end of the branching syllable and projected onto the leading GPFA factor. At the bottom of each panel, results from Linear Discriminant Analysis (LDA) showing instantaneous posterior (and prior, red) probabilities of accurately predicting the vocal transition class at each time-point from the corresponding HVC and/or RA latent state. The 95% confidence intervals are shown around mean posterior probabilities.

