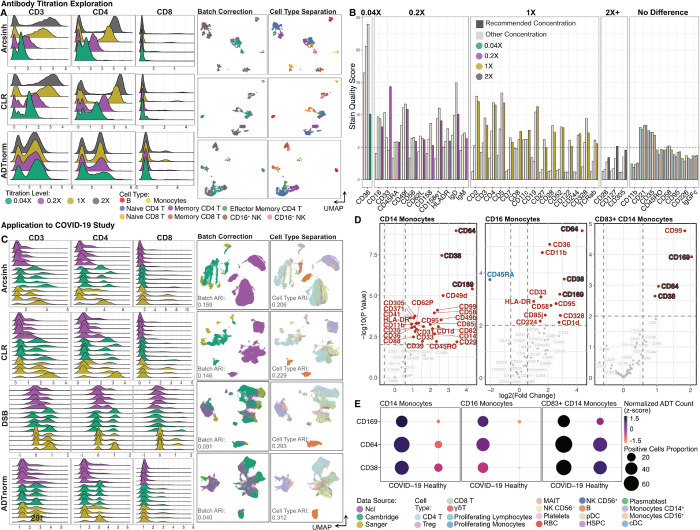
Figure 2. ADTnorm application to antibody titration determination and COVID-19 related disease study. A.
ADT expression distributions of three T cell lineage markers (CD3, CD4 and CD8) across samples stained at 1/25, 1/5, 1 and 2 times the commercially recommended antibody concentration following normalization by Arcsinh, CLR or ADTnorm. UMAP displayed the batch correction across the four antibody concentrations and cell-type separation using 124 ADT markers provided by the original paper17. B. Stain quality score is utilized to determine the positive population and negative population separation power (Methods). The lowest titration with sufficient separation of positive and negative cells (dashed line indicates stain quality score of 5) is highlighted for each protein marker with increased saturation. C. Data integration across three research institutes where CITE-seq was generated. UMAP shows the batch correction across three research institutes and cell type separation compared across Arcsinh, CLR, DSB and ADTnorm. DSB is the normalization method used in the original paper13. UMAPs were constructed on 192 ADT markers colored by research institute or cell type. D. Volcano plots displaying results of differential proportion of the positive cells for each protein marker between healthy donors and COVID-19 patients. The differential detection analysis was done for CD14+ Monocytes, CD16+ Monocytes and CD83+ CD14+ Monocytes, respectively. Cell type labels are from the original publication13 of the COVID-19 data. E. Dot plot displays consistently differentially expressed protein markers, i.e., CD38, CD64 and CD169, across three monocyte subsets. Points are colored by the average normalized ADT expression and the dot size is relative to the proportion of cells with positive-expression in healthy donors or COVID-19 patients.

