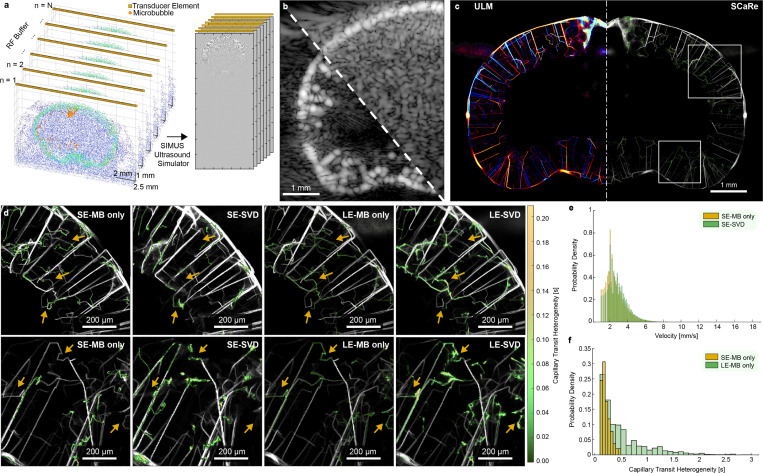
Fig. 2.
a. Ultrasound data generation pipeline from scatterer distribution & probe orientation to RF data simulation. b. Representative examples of simulated RF data, beamformed using delay-and-sum, with and without clutter. c. Representative super-resolution ULM-SCaRe maps of accumulated tracks over 350 buffers using long ensemble microbubble only (LE-MB). d. Zoomed images of the ROIs found in c. where the top row corresponds to the top ROI, and the bottom row to the bottom ROI. From left to right: SE-MB only, SE-SVD (20/1000 eigenvalue cutoff), LE-MB only, LE-SVD (20/6000 eigenvalue cutoff) e. Probability density histograms of velocity changes between tracked microbubble-only velocities and SVD filtered velocities in SE conditions. f. Probability density histogram of tracked capillary heterogeneous transit-time, predicted by the trained HMM, for SE vs LE.

