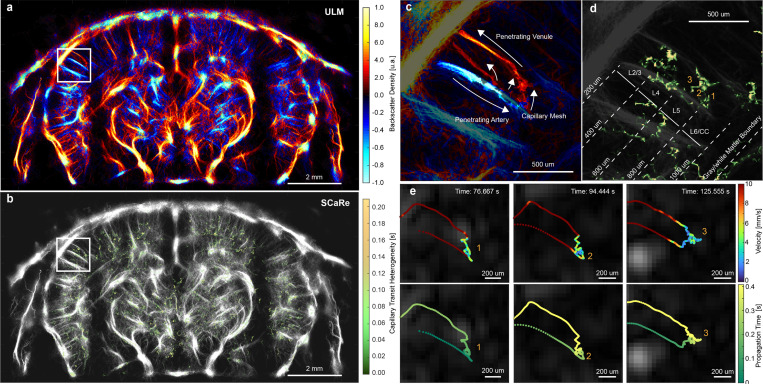
Fig. 4.
a. Representative ULM maps of a wild-type mouse brain using LE-SVD and track-pairing. b. Representative whole brain SCaRe map of measured capillary tracks with color bar representing the pixel-wise capillary time heterogeneity. c. Zoom panel in a of a completed vascular path with descent in the penetrating arteriole (blue), the ascent out of the penetrating venule (red), and the capillary mesh in between. d. Zoom panel in b illustrating tracked capillary networks in neuronal layers 5 and 6. e. tracks from 3 different capillary paths through the same arteriole and venule separated by microbubble velocity and time of travel through the vascular network.

