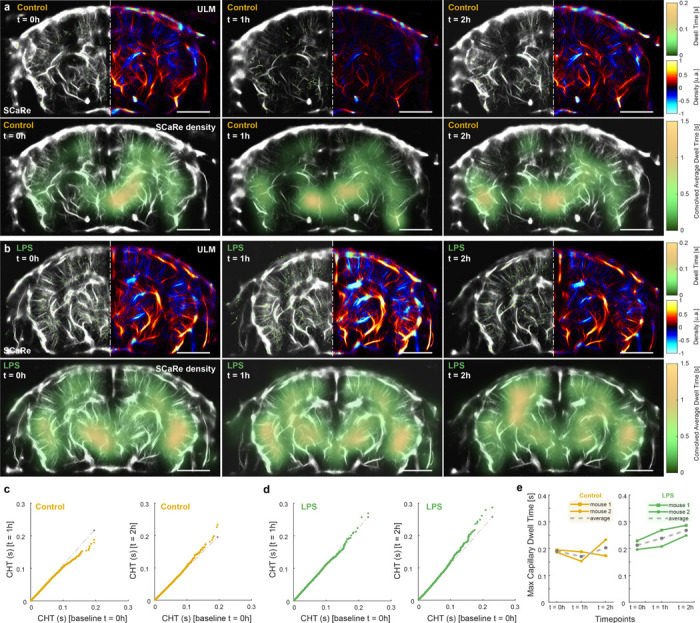
Fig. 5.

a. Representative SCaRe ULM at time points 0h, 1h, and 2h for negative control mice (no injection). b. Representative SCaRe ULM at time points 0h, 1h, and 2h after LPS injected mice. c. QQ plots of CHT for control mice comparing time points 1h and 2h against the baseline (0h). d. QQ plots of CHT for LPS injected mice comparing time points 1h and 2h against the baseline (0h). e. Max dwell time over the entire 5 minute scan time (n = 2 per group) as a function of time points for control and LPS mice. The mean value is shown as the grey dotted line.
