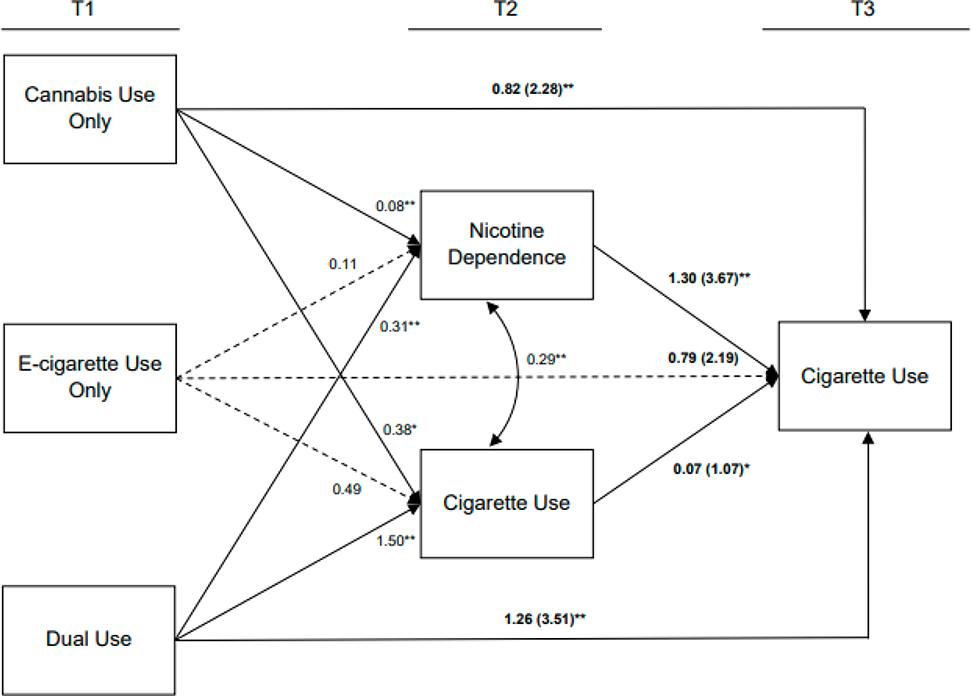
Figure 3.
Mediational path analysis model. Analytic sample N=1164. Negative binomial regression model in path analysis adjusting for all sociodemographic factors (eg, age, gender, race/ethnicity, and socio-economic status) and baseline past 30-day cigarette use or other tobacco products and nicotine dependence) presented in table 1. Reference group of joint cannabis and e-cigarette use status at T1 was ‘No use’. Estimates on pathways linking T1 to T2 were unstandardised regression coefficients. Estimates on pathways (bold text) linking T1/T2 to T3 were rate ratios (RRs; 95%CIs are presented in online supplemental table S2). **p<0.001; *p<0.05 (two-tailed).

