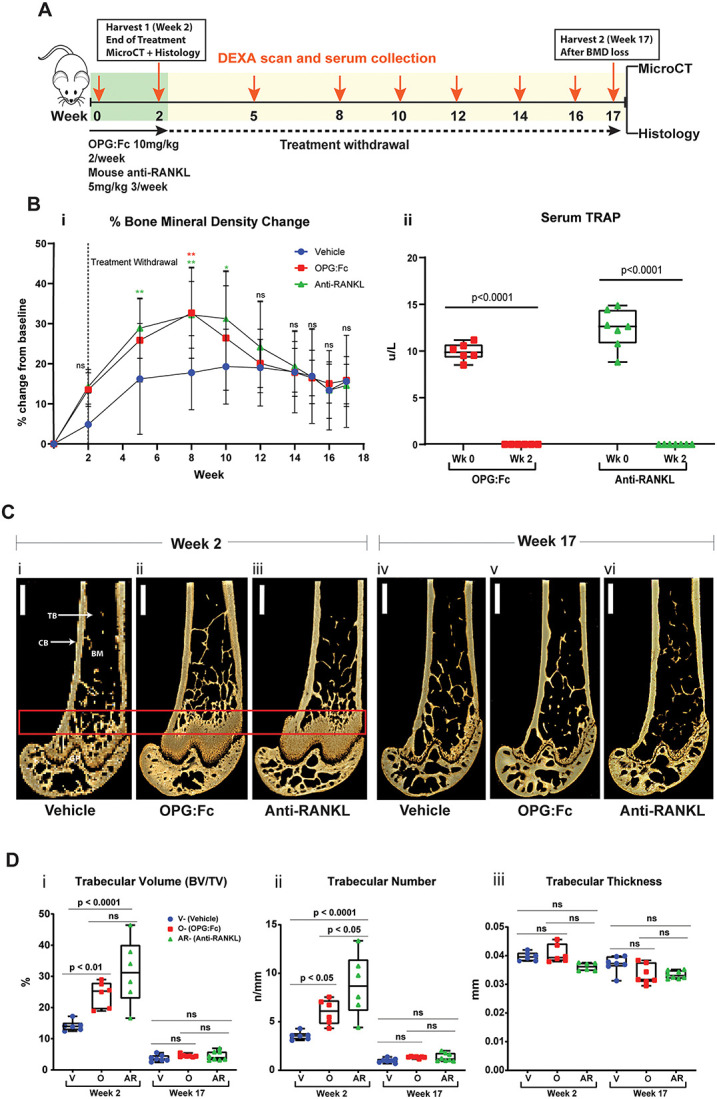
Figure 1.

RANKL inhibition with OPG:Fc increases BMD, and treatment withdrawal leads to loss of bone mass and density. (A) Schematic of the experimental design to assess the effect of treatment with OPG:Fc or murine anti-RANKL antibody. (B) BMD and TRAP changes following treatment. (i) BMD shown as a percentage change from baseline levels following treatment with OPG:Fc (n = 9), murine anti-RANKL antibody (n = 9), or saline (vehicle, n = 9). Dotted line showing the end of treatment at week 2. Data represented as mean ± SD. Asterisks indicate P-values < .05 (*P < .05, **P < .01). (ii) Serum TRAP measured by ELISA at baseline and following 2 wk of treatment with OPG:Fc (n = 6) or murine anti-RANKL antibody (n = 7). Boxplots represent mean ± SD. (C) Representative 3D microCT reconstructed images of the right femur at the end of 2 wk of treatment (i)-(iii) and at the end of the study (iv)-(vi). Box highlighting the region of interest. CB, cortical bone; TB, trabecular bone; BM, bone marrow. (D) MicroCT analysis of the region of interest showing trabecular volume (i), number (ii), and thickness (iii) at the end of treatment (week 2, n = 6-7 per group) and at the end of the study (week 17, n = 9 per group). Boxplots represent mean ± SD. V, vehicle; O, OPG:Fc; AR, anti-RANKL.
