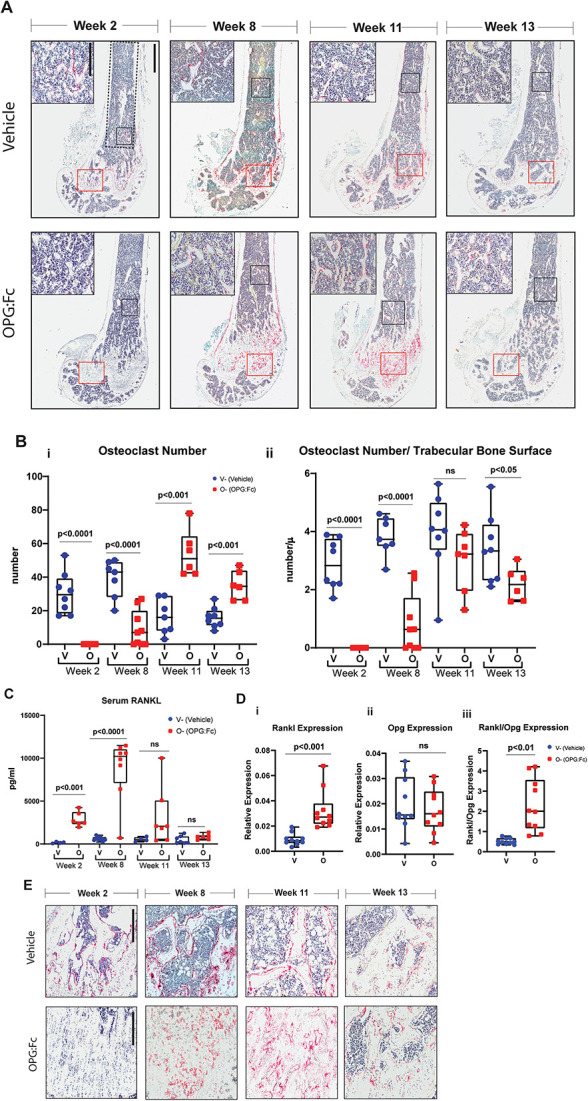
Figure 5.

Changes in osteoclast number and activity during rebound bone loss following withdrawal of RANKL inhibition with OPG:Fc. (A) Representative histological images of femora stained with TRAP (red) harvested following treatment with saline or OPG:Fc. Analysis of osteoclast parameters on trabecular bone was performed within the ROI defined by the dotted line (scale bar 900 μm at 2.2× magnification). Representative high magnification images shown in top left corner and its corresponding ROI shown in the black box (scale bar 300 μm at 9.8× magnification). Red box (near bottom of image) denotes osteoclasts observed on trabecular bone surfaces as shown in magnified images in Figure 5E. (B) Quantification of number of osteoclasts (i) and osteoclast surface (ii) per trabecular bone surfaces at harvest timepoints week 2, 8, 11, and 13. Boxplots represent mean ± SD. (C) Quantification of serum RANKL following OPG:Fc treatment. Boxplots represent mean ± SD. (D) Quantification of mRNA expression of (i) Rankl, (ii) Opg, and (iii) Rankl:Opg in marrow depleted femora of mice treated with saline or OPG:Fc harvested at week 8. Boxplots represent mean ± SD. Representative images of osteoclasts observed on trabecular bone surfaces throughout the study in the ROI marked by the red box in Figure 5A (scale bar 300 μm at 7× magnification).
