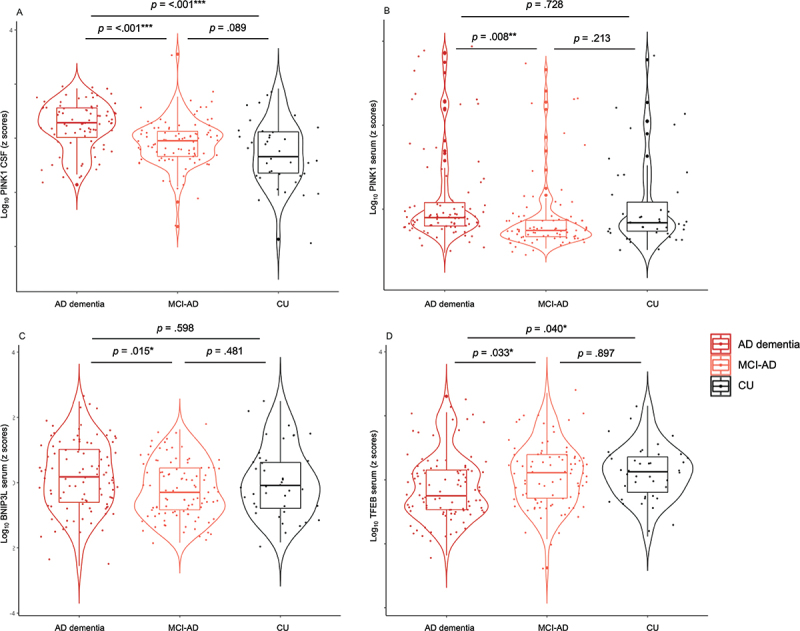
Figure 1.

Changes in mitophagy biomarkers across AD continuum. Violin plots of ANCOVA analyzes (A–D) levels of mitophagy markers PINK1, BNIP3L, and TFEB in biomarker-defined individuals. (A) CSF PINK1 showed higher levels in AD dementia compared to MCI-AD and CU groups. (B) Serum PINK1 showed higher levels in AD dementia compared to MCI-AD group. (C) Serum BNIP3L showed higher levels in AD dementia compared to MCI-AD group. (D) Serum TFEB showed lower levels in AD dementia compared to MCI-AD and CU groups. Notes: Data were adjusted for sex and age. *** = p < .001, ** = p < .01, * = p < .05. Abbreviations: AD, Alzheimer disease; MCI, mild cognitive impairment; CSF, cerebrospinal fluid; CU, cognitively unimpaired.
