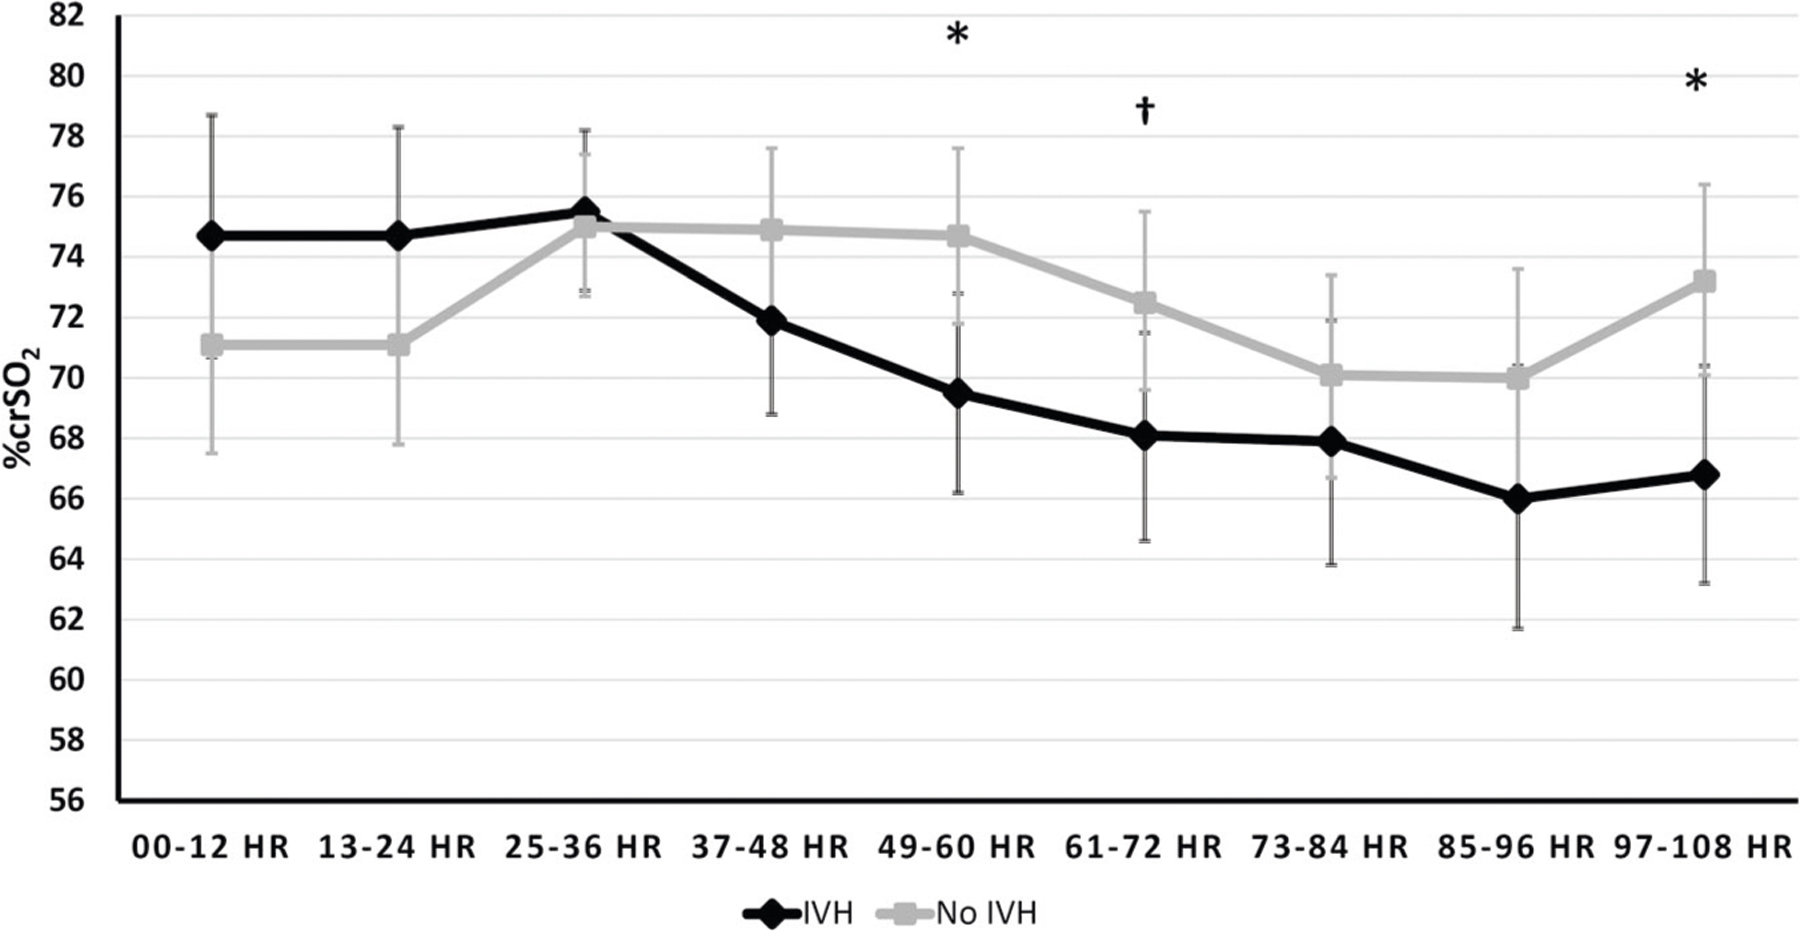
Fig. 2. Trajectories of %crSO2 (least square means and 95% CIs) over time by IVH status.

Repeated measures analysis with intrafamilial clustering among subjects using linear mixed models adjusted for potential confounding by gestational age at birth, birth weight z score & baseline hematocrit, base deficit and pCO2. *p < 0.05; Least square means (95% CI): 49–60 h (IVH 69.5 (66.2, 72.8); no IVH 74.7 (71.8, 77.6), p = 0.0232); 97–108 h (IVH 66.8 (63.2, 70.4), no IVH 73.2 (70.1, 76.4), p = 0.0104). †p < 0.1; Least square means (95% CI): 61–72 h (IVH 68.1 (64.6,71.5), no IVH 72.5 (69.6,75.5), p = 0.0584).
