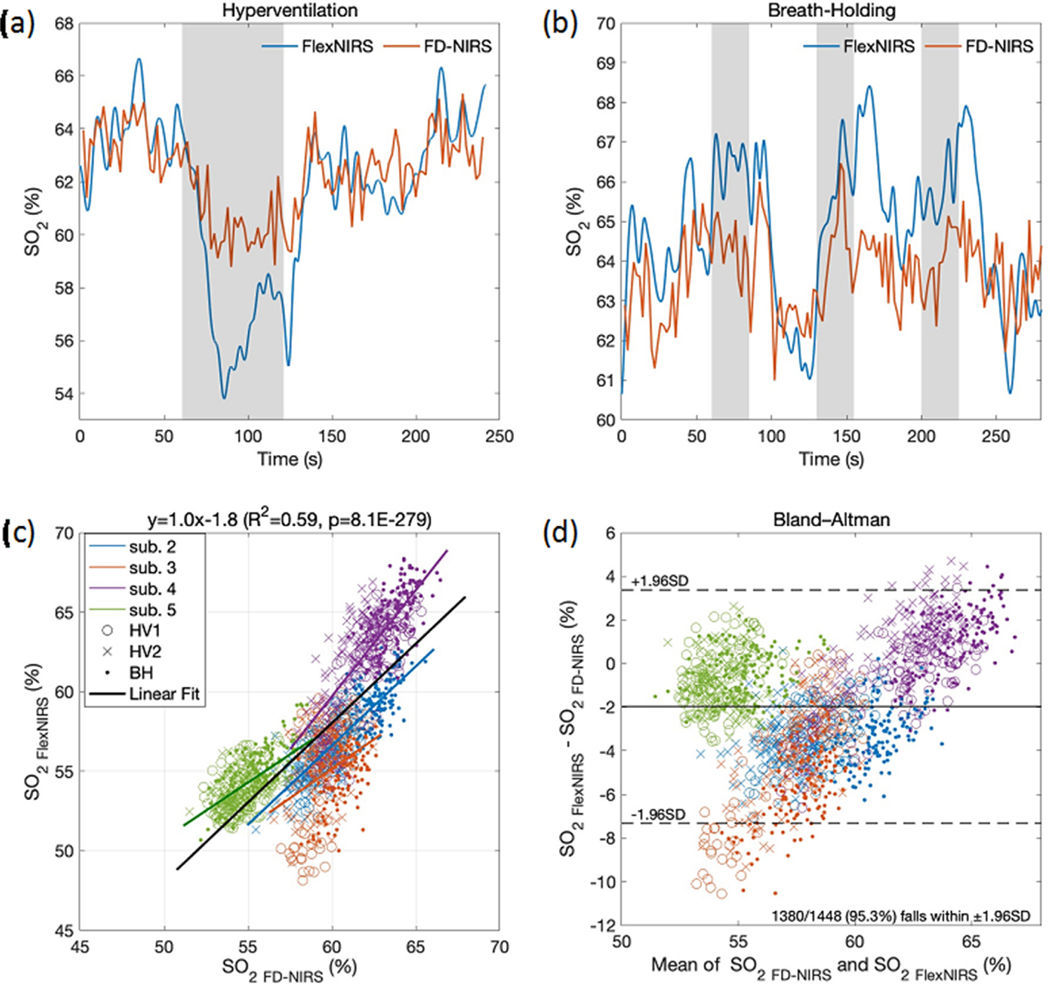
Fig. 9.
(a) and (b) time-traces during hyperventilation and breath-holding in a representative subject (subject 4) measured simultaneously with the FlexNIRS (blue) and the FD-NIRS (red) devices. The FlexNIRS data is acquired at 100 Hz and filtered with a low pass filter of 0.5 Hz. The FD-NIRS is acquired at 10 Hz and averaged every 20 points. Gray bars indicate the breathing task period. (c) Scatterplot and (d) Bland-Altman plot of measured with the FlexNIRS and the FD-NIRS devices during 2 hyperventilation and 3 breath-holding repetitions. Each point is a 2 s average. For the FlexNIRS, we used fixed reduced scattering coefficients of 6.8 and 5.9 cm−1 at 735 and 850 nm, respectively, which differ from the values measured and used for the FD-NIRS results. For subjects 2 to 5, the measured are 9.9 and 9.1, 10.3 and 8.2, 10.2 and 8.0, and 13.4 and 11.7 cm−1, at 735 and 850 nm, respectively (average wavelength dependence exponential fit . Despite the different scattering values, we obtained a good agreement between the two measured.

