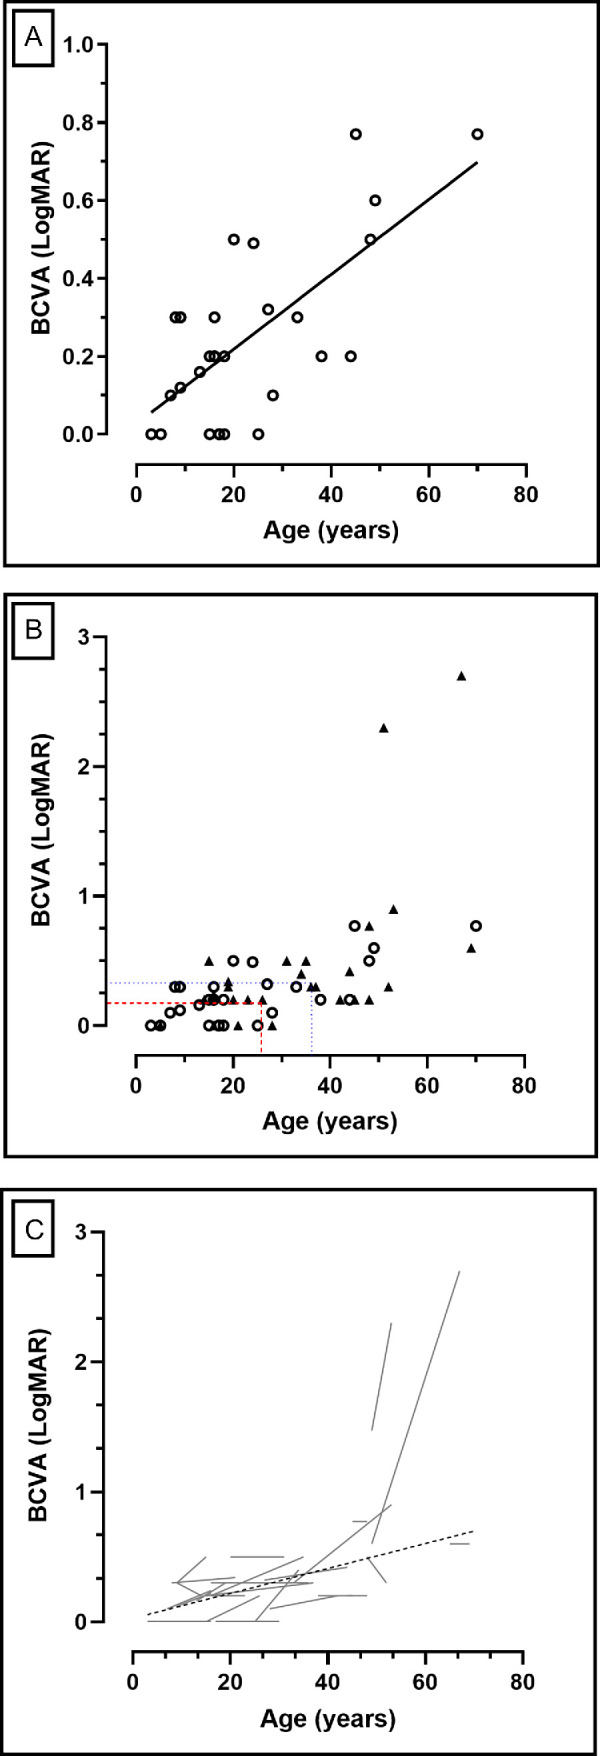
Figure 2.

Best corrected visual acuity (BCVA) changes over time. (A) Simple linear regression of BCVA at the baseline visit against age. There is a significant reduction of vision (P < 0.0001) with age. (B) Baseline and longitudinal BCVA. The red dashed lines show the mean age and BCVA at baseline –23.7 years and 0.28 LogMAR, respectively – whereas the dotted blue lines represent the mean age and BCVA at follow-up –33.2 years and 0.46 LogMAR, respectively – after a mean follow-up of 9.5 years. The mean annual loss rate in BCVA was 0.018 LogMAR/year. (C) The gray lines are representing individual progression of the right eyes of each subject in this cohort, with the overall progression (linear regression) plotted as a dashed black line.
