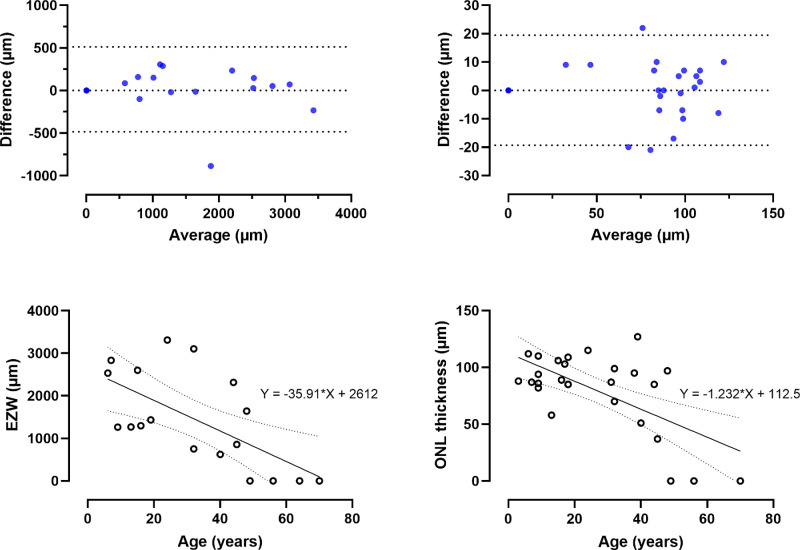
Figure 5.
Structural disease symmetry and change over time. The first row shows two Bland-Altman plots of the ellipsoid zone width (EZW) and outer nuclear layer (ONL) thickness. The 95% limits of agreement are plotted as dotted lines. The bias (±SD) was 14.21 µm (±254.1) for EZW, and 0.07 µm (±9.9) for ONL thickness, revealing high interocular agreement. The second row is a simple linear regression of EZW and ONL thickness against age, revealing negative trends, both of which were statistically significant (P = 0.004 and 0.0004, respectively).

