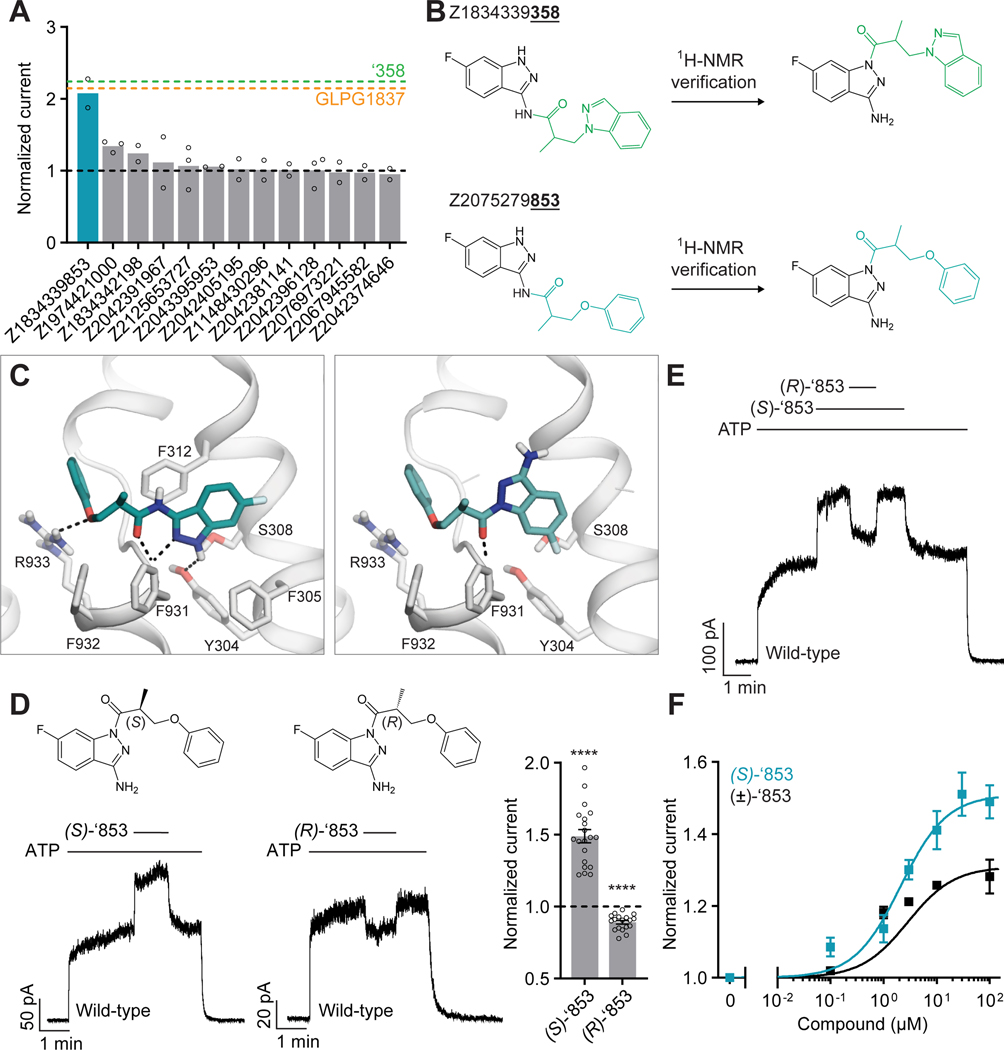
Figure 2: New modulators identified through an analog screen.
(A) Potentiation activity of ‘358 analogs. All compounds were tested at a single concentration of 10 μM in inside-out membrane patches containing fully phosphorylated WT CFTR. The current stimulation levels of GLPG1837 and ‘358 are indicated as dashed lines. (B) Reported structures versus the NMR-determined structures. (C) Docked poses of the reported structure of ‘853 (left) versus the NMR-determined structure of ‘853 (right). (D) (S)-’853 potentiates WT CFTR currents, while (R)-’853 mildly inhibits them in inside-out patches. Both enantiomers were perfused at 100 μM concentration. Data represent means and SEs of 20 ((S)-’853) or 18 ((R)-’853) patches. Statistical significance relative to no effect was tested by two-tailed Student’s t-test (****P = 2.3×10⁻⁹ for (S)-’853 and P = 1.6×10⁻⁷ for (R)-’853). (E) Competition assay showing that the presence of (R)-’853 (100 μM) diminishes the potentiating effect of (S)-’853 (100 μM). (F) Dose-response curve of (S)-’853 versus the racemic mixture (±)-’853, as described for Figure 1E. The EC50 for (S)-’853 was estimated to be 2.1 ± 0.9 μM. Data represent means and SEs of 2–20 patches. 3 mM ATP was used in all panels.

