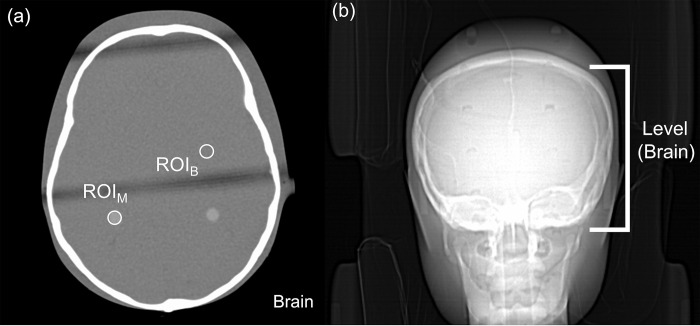
Fig 2.
Determination of the axial image quality for the 1-year-old AP brain (window width/level = 400/40) (a) Two 20-mm2 areas of brain parenchyma were encircled as regions of interest (ROIs), and the mean CT number (CT#M) and its standard deviation (SDB) (Hounsfield Unit, HU) were determined for the ROIs. The standard deviation (SD, HU) of the mean CT number (CT#M) within the ROI over the target region (ROIM) and background (ROIB) (b) The brain level.

