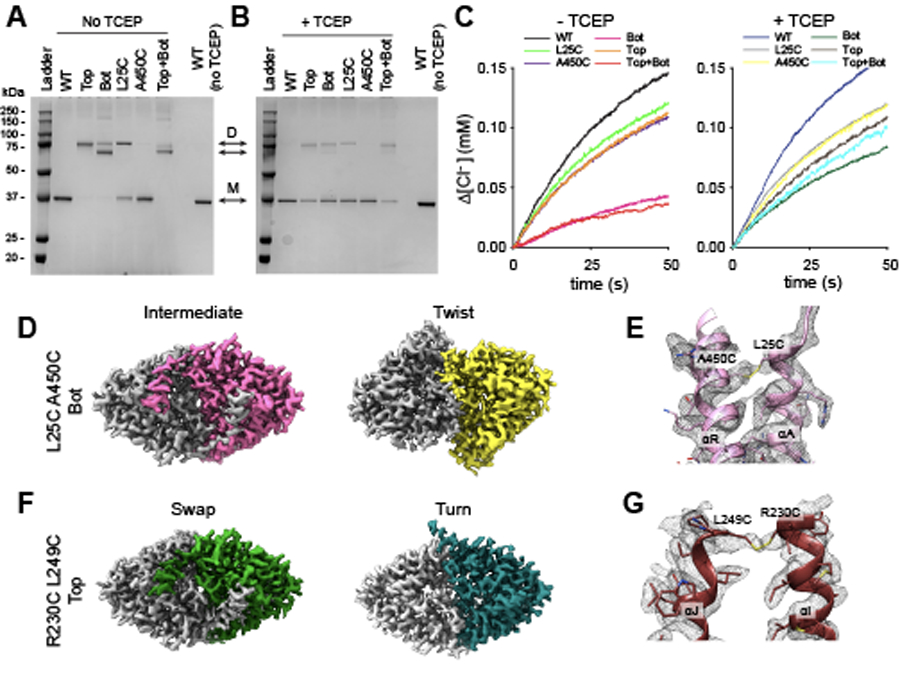
Extended Data Fig. 4. Characterization of Top and Bot crosslinks.

(A-B) SDS PAGE showing the molecular mass of TCEP-treated (right) or untreated (left) CLC-ec1 WT, Top (R230C/L249C) and Bot (L25C/A450C) crosslinks, L25C and A450C single mutants, and the Top+Bot quadruple mutant. Arrows denoted by D and M indicate the position of the dimer and monomer, respectively. Note that L25C on helix αA spontaneously forms dimers, reflecting crosslinks between the two dynamic αA helices. This results in two dimer bands for the Bot and Top+Bot crosslinked constructs, where αA of one protomer is crosslinked either to αA or αR of the sister protomer. SDS PAGE results were consistent in three repeats from independently obtained proteo-liposome samples of WT and all mutants. (C) Time courses of Cl− efflux mediated by TCEP-treated (right) or untreated (left) proteoliposomes reconstituted with CLC-ec1 WT (black/blue), Bot (pink/dark green), L25C (light green/gray), Top (orange/brown), A450C (purple/yellow) and Top+Bot (red/cyan). Traces for WT and Bot ±TCEP are the same as those shown in Fig. 2. (D) Intracellular view of cryoEM density maps of CLC-ec1 Bot crosslink in Intermediate (left panel) and Twist (right panel) conformations imaged at pH 4.5 in 100 mM Cl−. One subunit is colored gray, and the other is pink (Intermediate) or yellow (Twist). (E) CryoEM density (mesh) contoured at 5.1 Å and atomic model of the crosslink between A450C and L25C in Bot Intermediate. (F) Intracellular view of cryoEM density maps of CLC-ec1 Top crosslink in Swap (left panel) and Turn (right panel) conformations imaged at pH 4.5 in 100 mM Cl−. One subunit is colored gray, and the other is green (Swap) or aquamarine (Turn). (G) CryoEM density (mesh) contoured at 6.0 σ and atomic model of the crosslink between A450C and L25C in Top Swap.
