
Extended Data Fig. 5. Validation of maps and models for CLC-ec1 mutants.
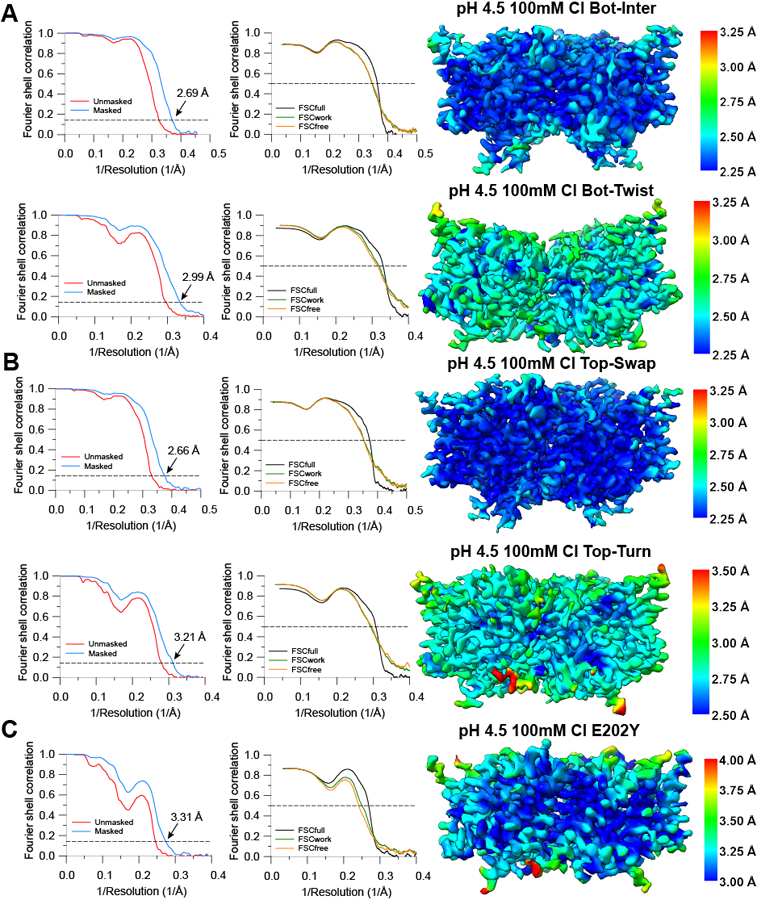
(A-C) FSC curves for the masked (tight mask from CryoSPARC) and unmasked density maps (left), FSC curves from model-map cross-validation (middle), and density maps colored by local resolution estimated in CryoSPARC (right) of maps obtained for CLC-ec1 (A) L25C/A450C Bot Intermediate and Twist, (B) R230C/L249C Top Swap and Turn, (C) E202Y. All data were collected at pH 4.5 and 100 mM Cl−. Data acquisition and refinement parameters are reported in Table 2.