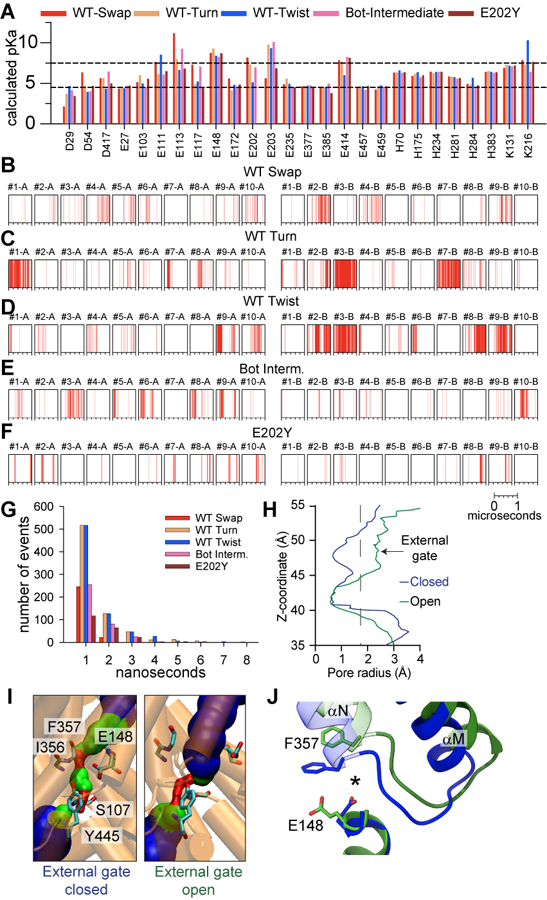
Extended Data Fig. 8. Water wire formation and Cl− pathway dynamics of CLC-ec1.

(A) The pKa values of the ionizable residues calculated using PropKa3,4. Black dotted lines correspond to pH 4.5 and 7.5. Data are not shown for residues with the calculated pKa values below 4.5 or above 7.5 in all conformations. (B-F) Spontaneous formation of water wires connecting Gluex and the intracellular bulk water within the H+ pathways of protomers A and B, observed in 10 independent 1 μs long simulations of CLC-ec1 WT in Swap (B), Turn (C), Twist (D), Bot Intermediate crosslinked (E), and E202Y (F). Each vertical line in the panels shows the occurrence of a water wire at that time point. The number of events of formation of water wires as a function of the lifetime of individual event. The lifetime of water wire is defined as the time duration for any hydrogen bond in the water wire to be disconnected. (H)Representative pore-radius profiles along the z-axis of the Cl− pathway, calculated using HOLE 1 for conformations with the open (green) and closed (blue) external gate seen in the MD simulations of Twist. (I) The diameter of the Cl− permeation pathway, visualized using HOLE 1 in MD snapshots of Twist with an open (right panel) and closed (left panel) extracellular gate. The external gate radius is calculated using the backbone atoms of residues 147, 148, 356, and 357. Residues S107, E148, I356, and Y445 are shown as sticks. Blue indicates regions with R>2.3 Å, green 2.3 Å>R>1.15 Å, and red R< 1.15 Å. (J) Representative snapshots of conformational rearrangements in the backbone of the Cl− pathway when the external gate is open (green) or closed (blue). * denotes the center of the Cl− permeation pathway.
