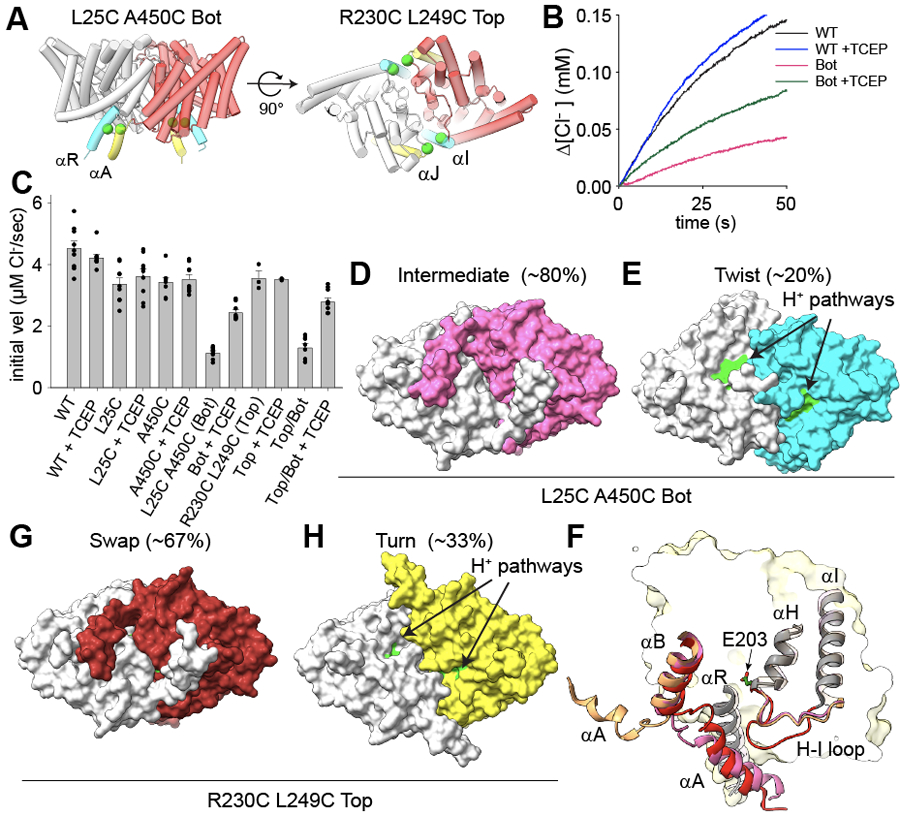
Figure 2: Opening of the H+ pathway is required for transport by CLC-ec1.

(A) Design of bottom (L25C/A450C, Bot) and top (R230C/L249C, Top) crosslinks. Side (top panel) and bottom (intracellular, bottom panel) views of CLC-ec1 (shown as cartoon with one protomer in gray and one in red) in Swap. Cα atoms of mutation sites are shown as green spheres. Crosslinked helices are colored in yellow and cyan. (B) Time courses of Cl− efflux mediated by CLC-ec1 WT without (black) and with TCEP (blue), and Bot without (pink) and with TCEP (green). (C) The initial velocity of Cl− efflux from proteo-liposomes containing WT or mutant CLC-ec1. All values are means ± S.D. Circles represent the values of individual experiments. Exact values, the number of repeats of independent experiments and preparations of proteo-liposome samples for all constructs are reported in Supplementary Table 1. (D-E) Surface representation of CLC-ec1 Bot in Intermediate (D) and Twist (E) viewed from the intracellular side. Residues lining the H+ pathway are colored as in Fig. 1. One protomer is shown in gray and the other is colored pink (Intermediate) or cyan (Twist). The percentages of particles in each conformation are indicated in brackets. (F) Close-up view of the H+ pathway vestibule in CLC-ec1 WT in Swap (red), Turn (wheat), and Bot Intermediate (pink). Helices αA, αB, αH, αI and connecting loops are shown in the cartoon representation; E203 is shown in stick representation. (G-H) Surface representation of CLC-ec1 Top crosslinked in Swap (G) and Turn (H) viewed from the intracellular side. Residues lining the H+ pathway are colored as in Fig. 1. One protomer is shown in gray and the other is colored in dark red (Top Swap) or limon (Top Turn).
