
Figure 4: Substrate accessibilities of the H+ and Cl− pathways increase in Turn and Twist.
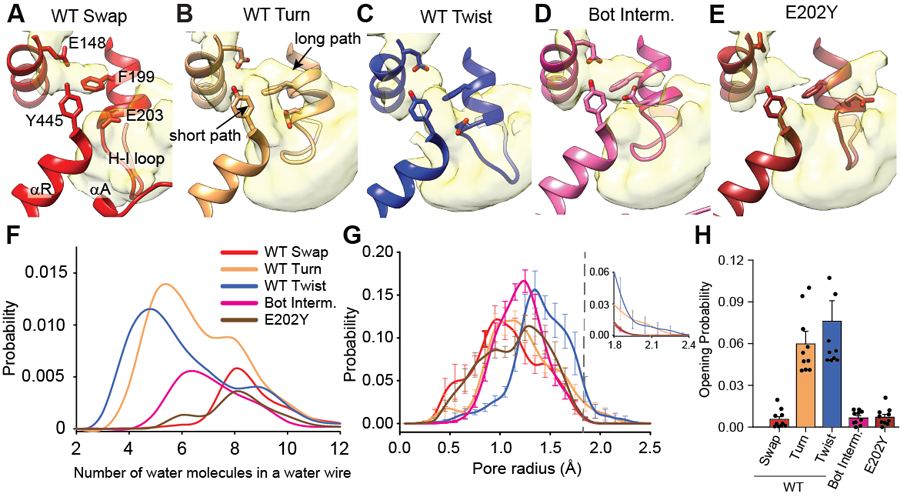
(A-E) Water accessibility of the intracellular H+ pathway vestibule CLC-ec1 WT in Swap (A), Turn (B), Twist (C), Bot Intermediate (D), and E202Y (E). αA, αR, and the H-I loop are shown in cartoon representation. E148, F199, E203, and Y445 are shown in stick representation. Water density is calculated from 10 independent 1 μs long MD trajectories for each system and is shown in surface representation using a threshold of 0.05. (F) Probability distribution of spontaneous formation of ordered water wires connecting E148 to the intracellular solution observed in Swap (red), Turn (wheat), Twist (blue), Bot Intermediate (pink), and E202Y (maroon), as a function of the number of water molecules in the wire. The probability is calculated over the 10 μs total duration of the simulations. (G) Probability distributions of the external gate radius sampled in all trajectories, using the same colors as in panel F. The external gate radius is calculated using the backbone atoms of residues 147, 148, 356, and 357. The top left panel shows the magnified probability distribution for R>1.8 Å. (H) Open probability of the external gate in Swap (red), Turn (wheat), Twist (blue), Bot Intermediate (pink), and E202Y (maroon) calculated as the integral of the area under the radius probability distribution curve for R>1.8 Å. Data in G-H are shown as means ± SEM of 10 independent 1 µs-long MD runs for each condition (Supplementary Table 4).