
Extended Data Fig. 2. Validation of maps and models for WT CLC-ec1.
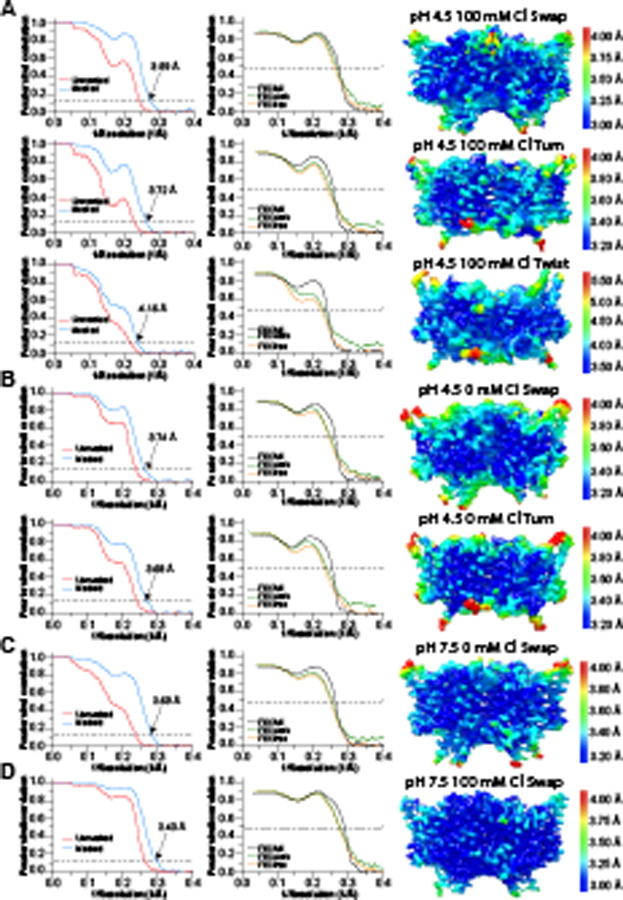
Fourier shell correlation (FSC) curves for the masked (tight mask from CryoSPARC) and unmasked density maps (left), FSC curves from model-map cross-validation (middle), and density maps colored by local resolution estimated in CryoSPARC (right) of maps obtained in the following conditions: pH 4.5 and 100 mM Cl− (A), pH 4.5 and 0 mM Cl− (B), pH 7.5 and 0 mM Cl− (C), pH 7.5 and 100 mM Cl− (D). Data acquisition and refinement parameters are reported in Table 1.