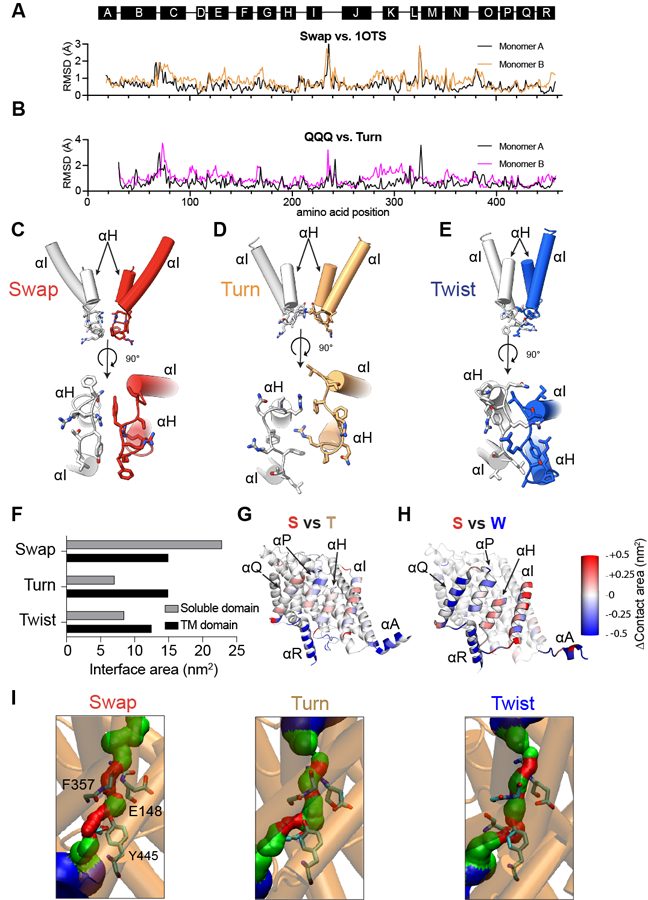
Extended Data Fig. 3. Structural comparisons between different CLC-ec1 conformations.

(A-B) Per residue Cα r.m.s.d. for CLC-ec1 in Swap at pH 7.5 and 100 mM Cl− relative to the crystal structure (PDB: 1OTS) (A) and for Turn at pH 4.5 and 100 mM Cl− relative to E113Q/E148Q/E203Q (QQQ, PDB: 6V2J) (B). (C-E) Close-up view of the rearrangements of the H-I loops in Swap (C), Turn (D), and Twist (E). The top panels are viewed from the plane of the membrane, and the bottom panels are viewed from the intracellular side. One protomer is colored gray, and the other is colored red (Swap), wheat (Turn), and Blue (Twist). Helices αH and αI are shown in cartoon representation, and residues Q207, F208, R209, Y210, T211, and L212 are shown in stick CPK representation. (F) Quantification of the surface area per protomer buried at the interface of the soluble (gray bars) and TM (black bars) domains in Swap, Turn, and Twist. (G-H) Cartoon representations of single protomers viewed from the dimer interface and colored by changes in per-residue contact areas in Turn (G) and Twist (H) relative to Swap. (I) Diameter of the Cl− permeation pathway visualized using HOLE 1 in cryoEM structures. The position of the external gate is defined as the midpoint of the backbone atoms of residues 147, 148, 356, and 357. Residues S107, E148, I356, and Y445 are shown as sticks. Blue indicates regions with R>2.3 Å, green 2.3 Å>R>1.15 Å, and red R< 1.15 Å.
