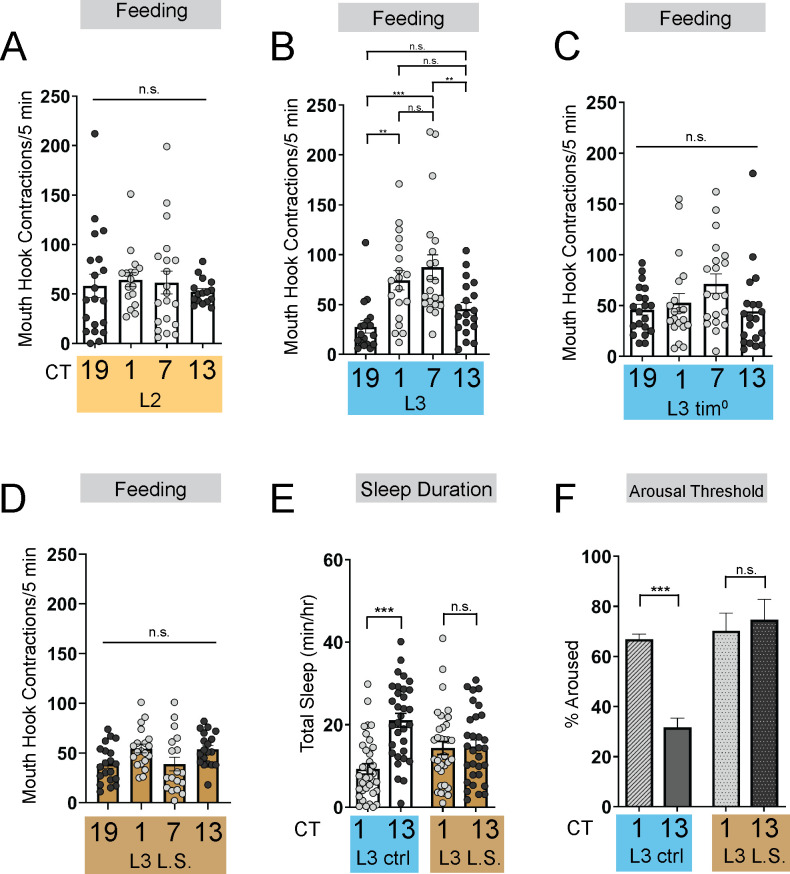
Figure 1. Energetic drive limits sleep rhythm development.
(A–D) Feeding rate (# of mouth hook contractions per 5 min) of L2 controls (A) L3 raised on regular (ctrl) food (B) L3 clock mutants (C) and L3 raised on low sugar (L.S.) food (D) across the day. (E) Sleep duration at CT1 and CT13 in L3 raised on regular (ctrl) and L.S. food. (F) Arousal threshold at CT1 and CT13 in L3 raised on regular (ctrl) and L.S. food. A-D, n=18–20 larvae; E, n=29–34 larvae; (F) n=100–172 sleep episodes, 18 larvae per genotype. One-way ANOVAs followed by Sidak’s multiple comparisons tests (A–D) Two-way ANOVAs followed by Sidak’s multiple comparison test (E–F). For this and all other figures unless otherwise specified, data are presented as mean ± SEM; n.s., not significant, *p<0.05, **p<0.01, ***p<0.001. Source data in Figure 1—source data 1.


