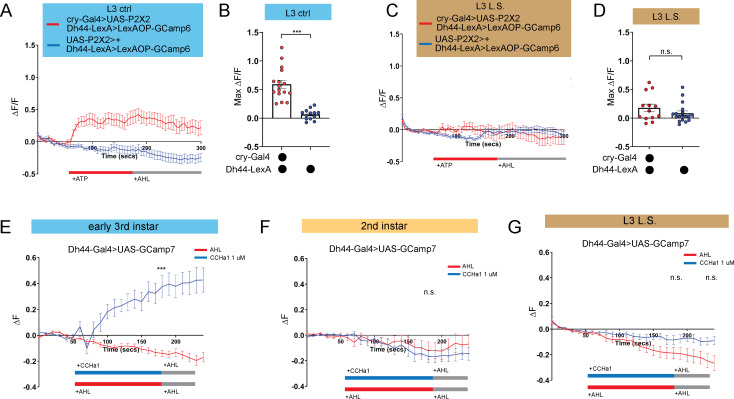
Figure 4. DN1a-Dh44 circuit formation is developmentally plastic.
(A, C) GCaMP6 signal in Dh44 neurons with activation of DN1a neurons in L3 controls (A) and L3 raised on L.S. food (C). Red bar indicates ATP application and gray bar indicates AHL application. (B, D) Maximum GCaMP change (ΔF/F) for individual cells in L3 controls (B) and L3 raised on L.S. food (D). (E–G) GCaMP7 signal in Dh44 neurons during bath application of 1 µM CCHa1 synthetic peptide in L3 controls (E), L2 controls (F) and L3 raised on L.S. food (G) brains. Red/blue bar indicates timing of CCHa1 (blue) or buffer (AHL, red) application and gray bar indicates timing of washout AHL application. (A-D) n=12–18 cells, 8–10 brains; (E-G) n=11–15 cells, 5–10 brains. Unpaired two-tailed Student’s t-tests (B and D) Mann-Whitney U test (E–G). Source data in Figure 4—source data 1.

