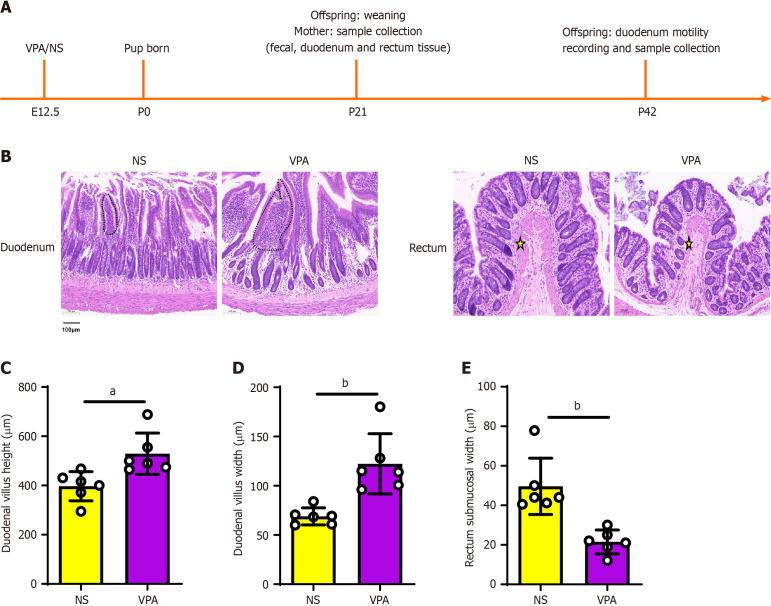
Figure 1.
Histological evaluation of intestinal tissue of the normal saline and valproic acid groups (hematoxylin & eosin staining; scale bar = 100 μm; 10 ×). A: Timeline of experimental design; B: Hematoxylin & eosin staining of the duodenum (above) and rectum (down). The duodenal villi are marked by dotted lines. The submucosa is marked by a yellow star; C and D: Histological statistics of duodenal villi height and width; E: Histological statistics of rectal submucosal width. Data are presented as the mean ± SD (normal saline group n = 6, valproic acid group n = 6). Unpaired t test, aP < 0.05, bP < 0.01. NA: Normal saline; VPA: Valproic acid.

